
This tutorial will provide a step by step guide on how to use the statfreaks Jockey Analysis Tool (JAT). It can be used to find potential winning rides and also invest into avaiable jockey challenge markets. Together, we will pinpoint possible value rides, validate results, calculate our profit and loss and return on investment.
The Jockey Challenge Analysis Tool (JAT) is part of the Statfreaks “Advanced Horse Racing Subscription Package.“
THIS TUTORIAL IS LEVEL

Requirements:
- Have completed tutorial JAT01 – JOCKEY CHALLENGE ANALYSIS TOOL INTRODUCTION
- Basic level understanding of spreadsheeting and mathematics.
- Microsoft Excel Installed on your local computer.
- An activate subscription to
- Drill down to pinpoint potential winning jockey and horse combination rides.
- Export findings to a spreadsheet for potential investment in jockey challenge markets and check results.
- Calculate staking and flat betting unit size, profit and loss and return on investment for the day.
To download sample files, you will need a statfreaks FREE membership. Click HERE to sign up.
Our research over the years has found that jockeys are the most underrated variable calculated in the market today. Many other systems out there on the market today are trying to profile a horse and not adding enough weight to the jockey on board. Most form guides, racing websites, and betting tools are designed in a way to break down race by race, runner by runner for an entire race. We will show you, that, with the right tools, data, and understanding of analytics you can look at things from a different angle and identify the possible value in a market which may not have factored in, especially in jockey challenge markets.
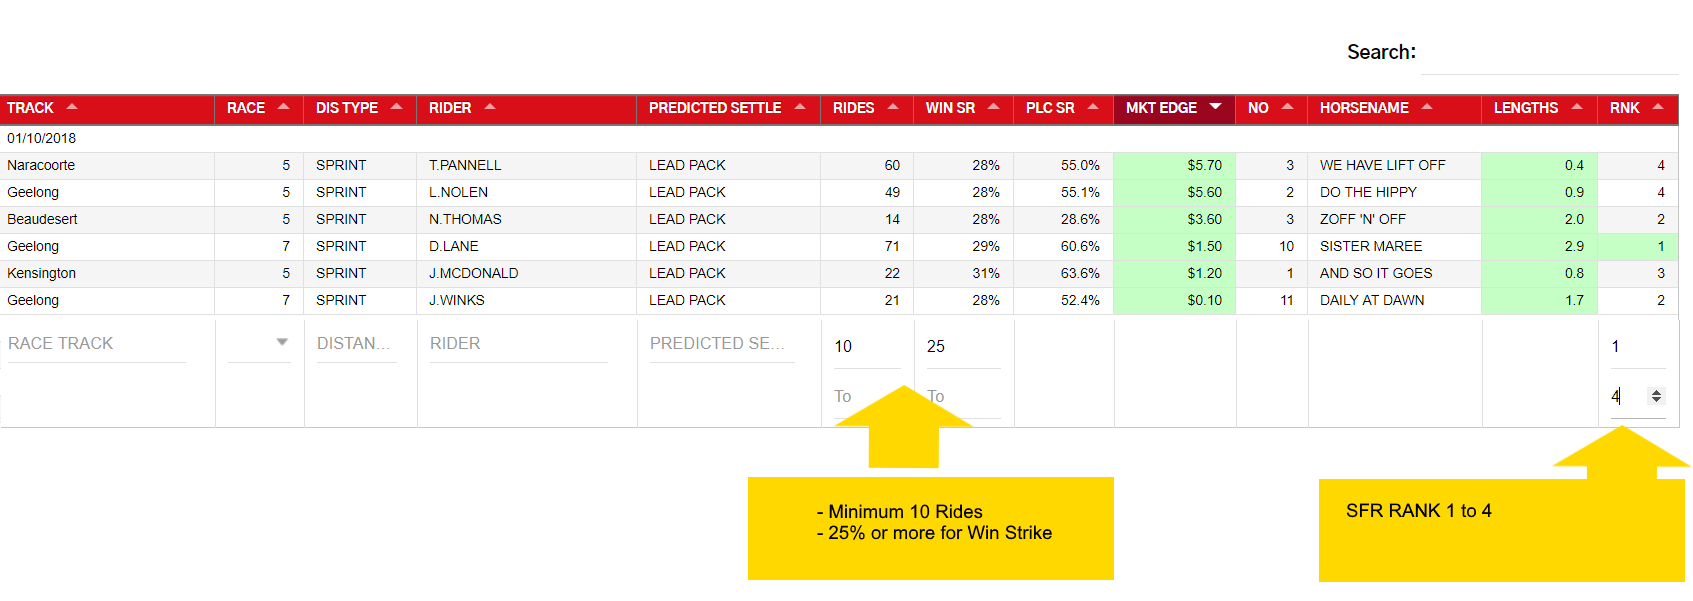
Finding a jockey that is saddled up on a value ride is not the easiest of tasks; therefore, we like to keep things simple by cut straight to it. By default, the Jockey Challenge Analysis Tool will load and sort on the win strike rate column in descending order (Largest to smallest), to allow the end user to identify a possible winning jockey and horse combinations quickly.
Set the following filter by scrolling to the bottom of the Table
- RIDES = 10
- WIN SR = 20
- RANK between 1 and 4
Why am I setting these filters?
To isolate jockeys with some data depth. By setting the rides to 10 as the minimum, we know the rider has had at least ten past rides in the last 365 days within the same distance group and settling position. By setting the win strike rate to a minimum of 20%, we know one in every five rides the jockey wins with the scenario. Setting the RANK between one and four ensures that the future rides rate in the Top 4 with the SFR (Statfreaks Rating). These filters are a starting point with narrowing down which riders have a chance of winning a jockey challenge.
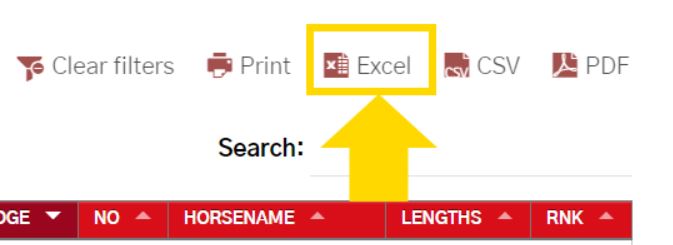
EXCEL
With the filters applied from the previous step, click the EXCEL icon. A spreadsheet data file containing the filtered data from the jockey challenge analysis tool will be exported to your downloads folder on your pc.
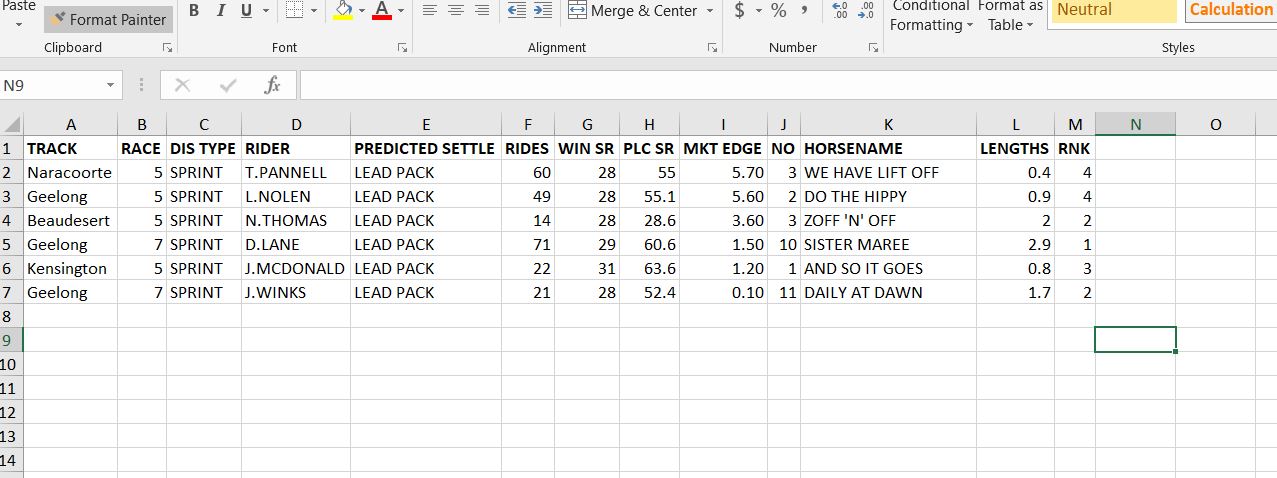
OUTPUT
Once you locate the excel file on your computer, it is best to save it to another location with an identifiable filename e.g. “TOPRIDES01102018.xlsx”. Within the file, it will contain all the information that you analyzed and filtered in the previous steps.
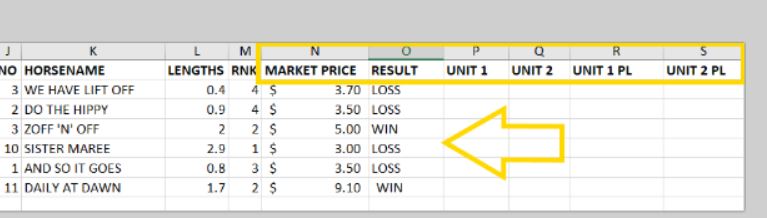
HEADINGS
In Excel, create the headings
- Market Price
- Result
- Unit 1
- Unit 2
- Unit 1 PL
- Unit 2 PL
MARKET PRICE
Get the market prices from your desired bookmaker. In this tutorial, we have used the Best Tote displayed on the TAB website. Populate every excel cell downwards with the horse’s market price from your bookmaker.
If you are framing up a jockey challenge market then don’t forget to get the price of the jockey available for the jockey challenge at the track.
RESULT
As each race completes, populate the result with a “WIN” or “LOSS” for each horse.
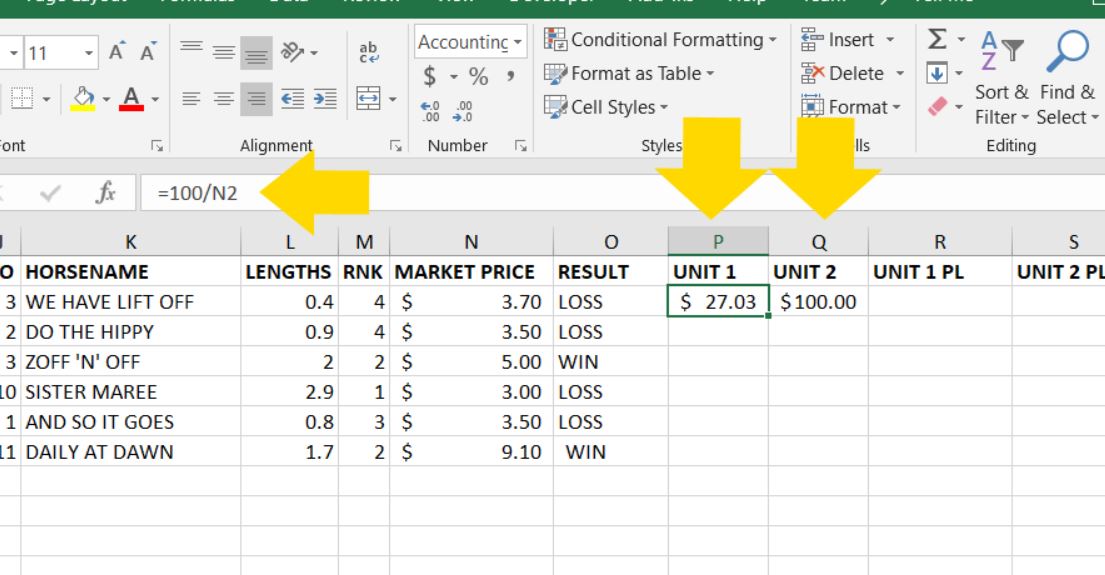
UNIT 1 – Proportional Staking from the Market Price
In Cell P2, we will create a betting unit by calculating a proportional staking size from the market price. To do this, complete the following steps
- Click on cell P2.
- Enter “=100/N2” (N2 is the market price we entered earlier)
- Press enter. You will notice that P2 now displays a proportional staking unit
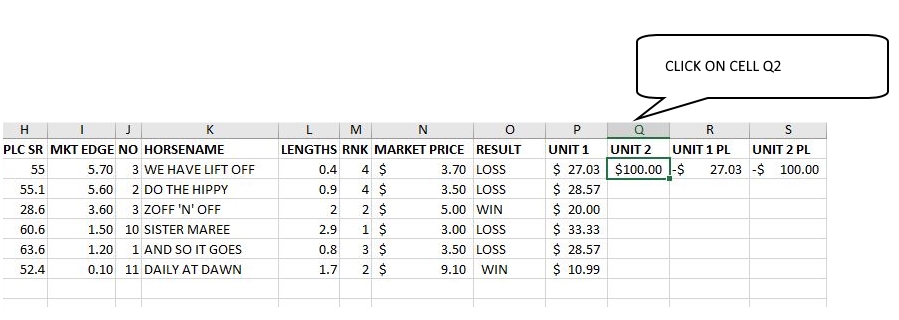
UNIT 2 – Flat Betting Unit
- In Cell Q2, type in 100 as our flat bet unit size.
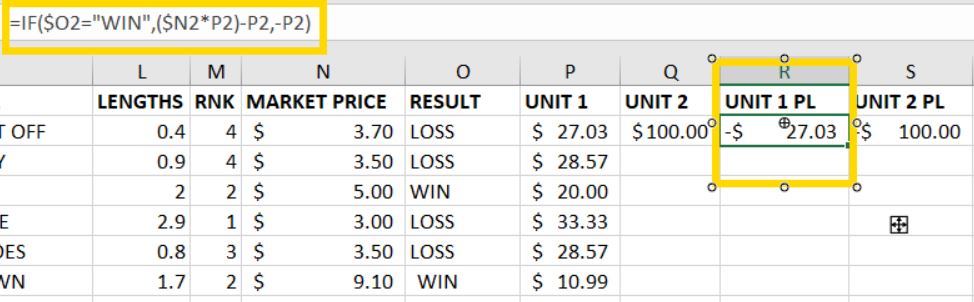
UNIT 1 – Profit and Loss
In Cell R2, we will create a formula which will calculate our profit and loss for that single runner.
- Click on cell R2.
- Enter =IF($O2=”WIN”,($N2*P2)-P2,-P2)
- Press enter. You will notice that P2 now displays the profit and loss for proportional staking
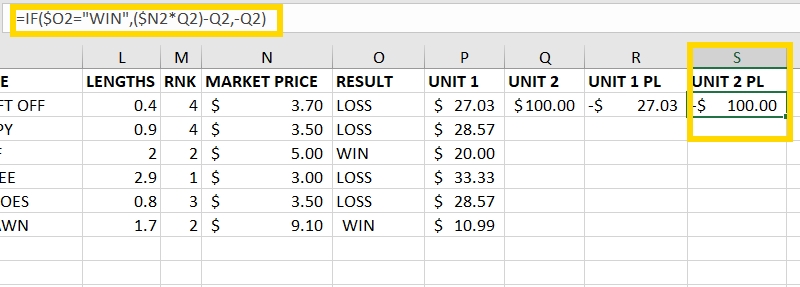
UNIT 2 – Flat Betting Profit and Loss
In Cell S2, we will create a formula which will calculate our flat betting profit and loss for that single runner.
- Click on cell S2.
- Enter =IF($O2=”WIN”,($N2*Q2)-Q2,-Q2)
- Press enter. You will notice that P2 now displays the profit and loss for flat betting
POPULATING SPREADSHEET ROWS
Now that you have completed the first-row calculation, we need to fill the remaining rows. Luckily Microsoft excel can do this for us automatically.
- Click on cell Q2.
- Press and hold the “SHIFT” key on your keyboard. Do not release it just yet.
- While holding “SHIFT,” click on the cell “S7”. You will notice all the cells highlight.
- Release the “SHIFT” key.
- Press and hold down the “CTRL” key. At the same time press the “D” key on your keyboard.
- Microsoft Excel will auto-populate can calculate the rows.
- You can click on any other cell now to un-highlight the selected cells.
The above is an important step which can save a lot of time when framing horse racing and a jockey challenge markets.
Once you have completed the above steps, “UNIT 1 PL” and “UNIT 2 PL” will display both profit and loss for both staking plans. Rember to save your spreadsheet by clicking File->Save or using the keyboard shortcut “CTRL” + “S.”

CALCULATING TOTALS
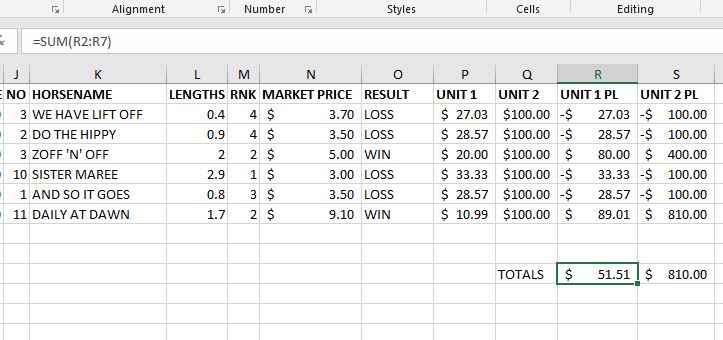
To calculate totals in excel, we need to sum together the rows for each runner.
- UNIT 1 PL Total
- Click on cell R10.
- Type in the formula “=SUM(R2:R7)”
- UNIT 2 PL Total
- Click on cell R10.
- Type in the formula “=SUM(S2:S7)”
Congratulations, You have now calculated total Profit and Loss for each staking plan.
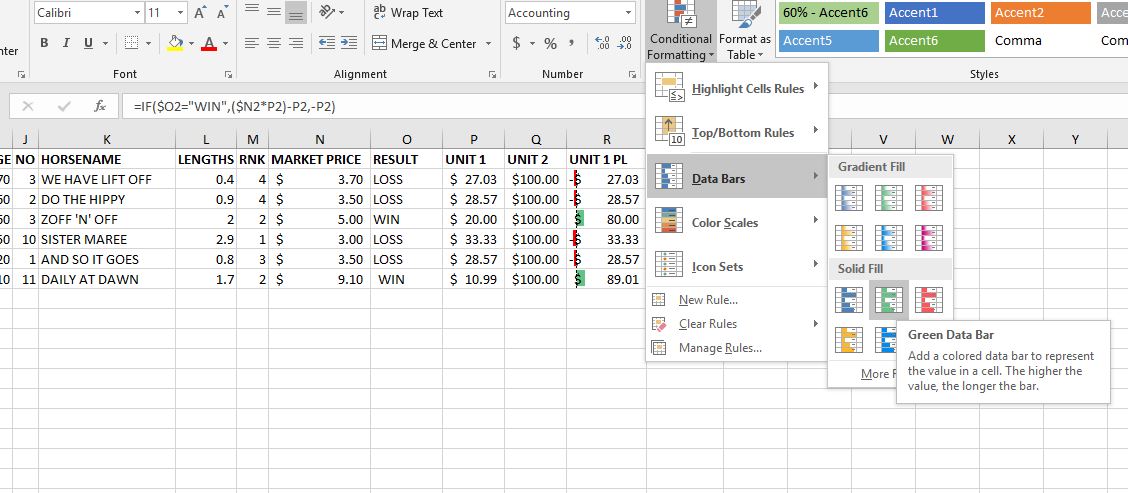
FORMATING COLUMNS
The next step is to format the columns so a positive return will display GREEN and a negative return will show in RED.
- Click on cell “R2”
- Hold down the “SHIFT KEY”
- Click on cell “S10”
- All the cells will highlight.
- Click on the “CONDITIONAL FORMATING ICON”
- Select “DATA BARS”
- Select “GREEN DATA BAR” located under “SOLID BARS.”
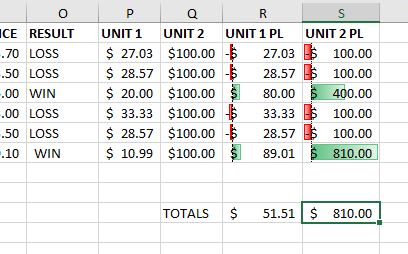
Your cells will now be highlighted GREEN for a profit, and RED when there is a loss.
CALCULATING ROI
To calculate the return on investment, we will use the following formula (Net Profit / Total Investment * 100)
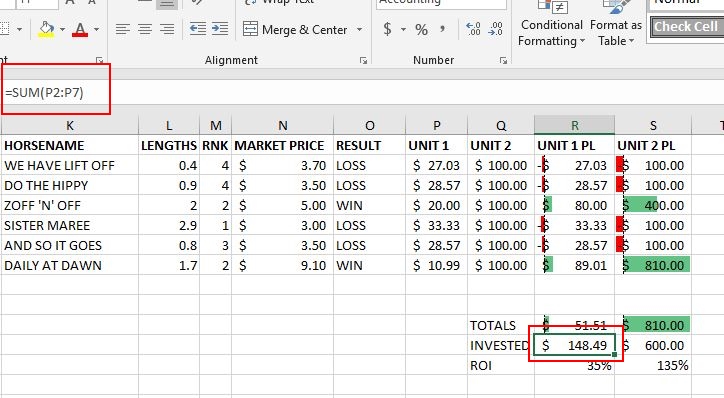
- Unit 1 Total Investment Calculation:
- Select cell “R11”, located below the Total’s column
- Enter “=SUM(P2:P7)” to sum all the units invested in “UNIT 1.”
- Unit 2 Total Investment Calculation:
- Select cell “S11”
- Enter “=SUM(Q2:Q7)” to sum all the units invested in “UNIT 2.”
We now have the total amounts invested for both staking plans. The next step is to calculate the ROI.
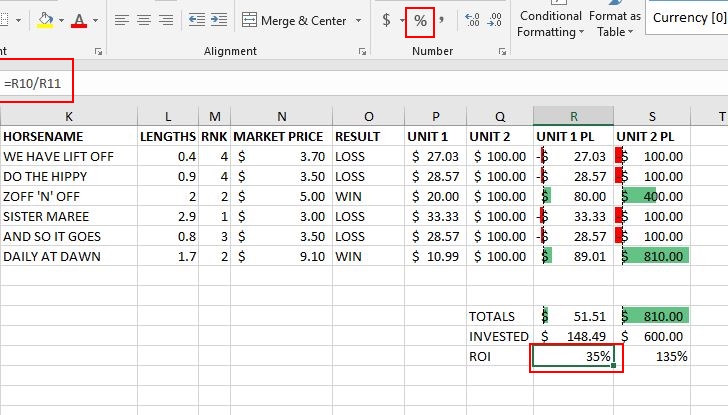
- ROI Unit 1 Calculation:
- Select cell “R12”
- Enter “=R10/R11“.
- ROI Unit 2 Calculation:
- Select cell “S12”
- Enter “=S10/S11“.
- Notice we have not multiplied by 100 as Excel has a percentage function we can use instead.
- Select cells “R12” and “S12” by clicking both while holding down “SHIFT.”
- Click on the “%” symbol in Microsoft excel, located at the top ribbon under the home tab.
TUTORIAL COMPLETION
Congratulations you have now completed the “JAT02 – Jockey Challenge Value Finder” Tutorial. We hope you have found this tutorial as exciting as we have and hope it can assist you in finding value jockey challenge rides from a different angle.
For further questions and feedback, please contact our team by clicking HERE.
