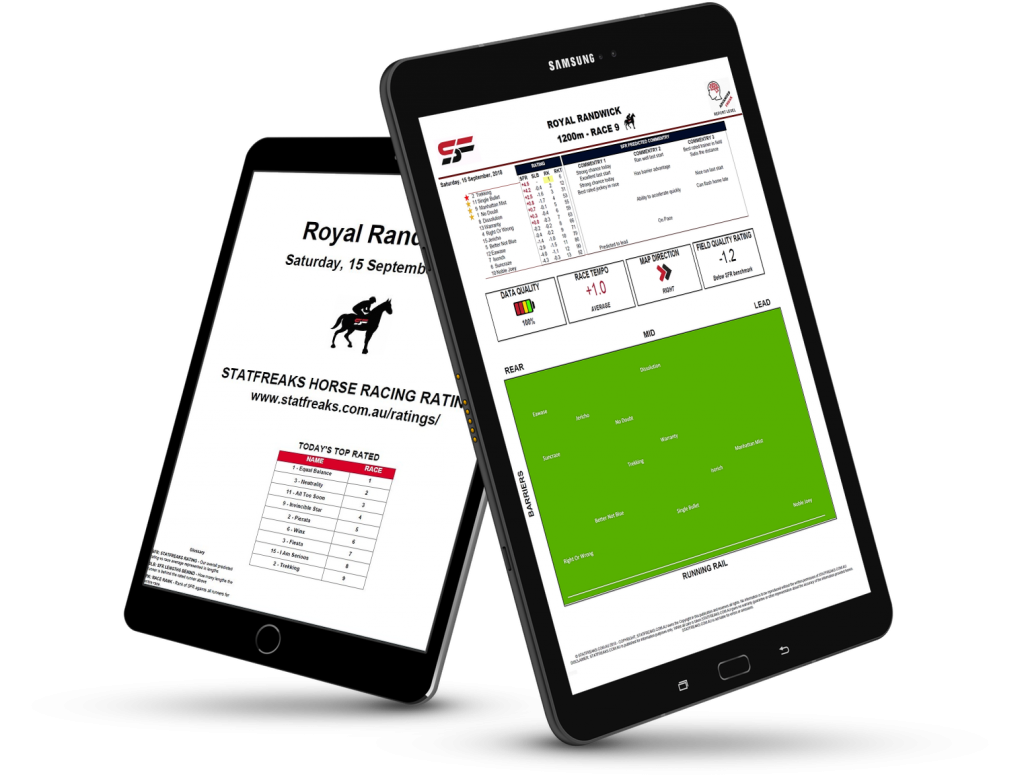
This article explores the horse racing winning odds statistics for favourites and their position in-run at the 800-meter point. The position in-run is one of the most common topics that is discussed in horse racing across many professionals and more importantly the winning odds statistics when settling in the lead pack. There are basic winning odds statistics, for example, the average winning strike rate statistic for favourites, then slightly more complex scenarios where the favourite is combined with a second variable, e.g., the runner’s position in-run at the 800-meter point. We will use the statfreaks “Market Price Virtual Data Table” to explore the horse racing winning odds statistics using these two variables.
The STATFREAK’S “Market Price Virtual Data Table” and other’s are available as part of the horse racing subscription package.
THIS ARTICLE IS LEVEL

Let’s begin by first taking a look at horse racing winning odds statistics for favourites at metro races across Australia. What’s a favourite? A favourite is a horse that has the lowest price across all runners in that specific race. Throughout this article we will refer to a favourite as “SP Rank 1” which represents, a horse who’s starting price in a horse race is ranked 1st, being the favourite.
Using the “Market Price Virtual Data Table,” we have set some filters to isolate horse racing winning odds statistics for favourites.
- Starting Price Rank “SPRank” = 1
- Position in Run at 800m “PIR800” = 1, 2 and 3
- Meeting Type = “M” (Metro Race’s Only)

Findings:
The STATFREAKS virtual data tables contain 365 days of data. Our snapshot whilst working with this data is from the 17/11/2018 at 3:00 pm. The data table shows the following horse racing winning odds statistics with the filters applied.
- When a horse is favourite and positioned
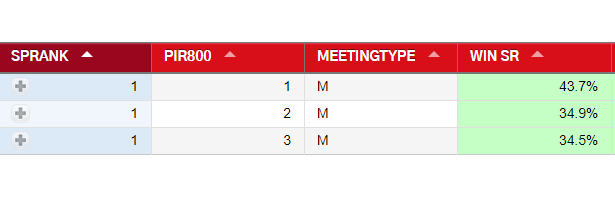
- 1st at the 800-meter mark in a Metropolitan race historically it has gone on to Win 43.7% per cent of the time.
- 2nd at the 800-meter mark in a Metropolitan race historically it has gone on to Win 34.9% per cent of the time.
- 3rd at the 800-meter mark in a Metropolitan race historically it has gone on to Win 34.5% per cent of the time.
Analyzing the horse racing winning odds statistics results, the lead horse (“SPRANK1”) has a significantly higher strike rate than the runners positioned 2nd and 3rd. Regardless of ratings, speed figures, tracks, distances, and condition, the data highlights that across most of the race type’s, “Lead” horse’s do have an advantage over runners who settle 2nd and 3rd back. A win strike rate of 43.7% per cent can convert to a dollar amount by dividing 100/percentage, in this case, would equal $2.28.
If you could successfully identify the lead horse before a race begins, across all metro race’s, you should end up with a winning strike rate hovering around the 43% per cent mark. I want to point out though; it is virtually impossible to predict the “Lead” horse 100 per cent of the time even, using the best predictive models and having the best processes in place will not factor in when horses miss the start, gets checked by surrounding horses early on or blocked when trying to gain a “Lead” position.
Exploring further horse racing winning odds statistics across “Provincial” meeting types we notice an interesting change. The win strike rate percentage has improved by 2.6 per cent, up to 46.3 per cent. There may be many different variables which make up the difference and are worth exploring. One theory which comes to mind is that as metro races are more competitive and have higher graded horses the advantage of leading at metros is weighted slightly less than of a provincial which carry lower graded horses. This theory may hold some weight especially when we analyze the horse racing winning odds statistics for “Country” type race’s later on in this article.

Findings:
At the point of taking this snapshot on the 17/11/2018 at 3:00 pm, the table shows the following horse racing winning odds statistics.
- When a horse is favourite and positioned
- 1st at the 800-meter mark in a Provincial race historically it has gone on to Win 46.3 per cent of the time.
- 2nd at the 800-meter mark in a Provincial race historically it has gone on to Win 36.9 per cent of the time.
- 3rd at the 800-meter mark in a Provincial race historically it has gone on to Win 33.7 per cent of the time.
Following a similar pattern to the “Metro” type race’s there is almost a 10 per cent difference between the “Lead” horse and 2nd positioned runner at the 800-meter point, further suggesting that overall “Leading” horses do fact poses an advantage.
Finally, we arrive at “Country” type race’s where the lowest rated horse’s mostly race. Leading at a country race and being a favourite win 47.3% per cent of the time which is 1% per cent higher than provincial, and 3.6% higher than country races. The result further supports the theory that as a meeting type drops from “Provincial” to “Country,” the importance of leading increases.

Findings:
At the point of taking this snapshot on the 17/11/2018 at 3:00 pm, the table shows the following horse racing winning odds statistics.
- When a horse is favourite and positioned
- 1st at the 800-meter mark in a Country race historically it has gone on to Win 47.3 per cent of the time.
- 2nd at the 800-meter mark in a Country race historically it has gone on to Win 37.2 per cent of the time.
- 3rd at the 800-meter mark in a Country race historically it has gone on to Win 33.8 per cent of the time.
Just like the “Metro” and “Provincial” type race’s there is almost a 10 per cent difference between the “Lead” horse and 2nd positioned runner at the 800-meter point, further suggesting that overall “Leading” horses do fact poses an advantage.

To conclude the analysis for racing winning odds statistics, let’s compare all three meeting types together and draw some conclusions.
What did we learn from this analysis?
From our results, it is clear that when leading and on a favourite at a metro race on average you will win 43.7% per cent of the time. As we move down to provincial type races the win strike rate for the same scenario increase to 46.3% per cent, and further to 47.3% per cent for country type meetings. In the horse racing winning odds statistics summary table above, we can also confirm that the same pattern exists in favourites when positioned 2nd, and 3rd at the 800-meter point.
How can I use these results?
If you are a form analyst and rating a field of runners, you may want to consider weighting the position in running variable across each meeting differently. At a country race, you may add more weight to leaders than you would for provincials and metros. If you are an in-play user on Betfair, this information may be of use if your strategy is around backing or laying runners.
There are many more angels across racing winning odds statistics which can be explored, including field sizes, distance, and condition. Stay tuned for future analysis articles where we hope to explore all different possible angels.
We hope you have enjoyed this article on racing winning odds statistics. Please feel free to make contact if you have any questions or feedback

