
This tutorial will demonstrate how to use the statfreaks Jockey challenge Analysis Tool which has been designed to assist you with isolating strong upcoming jockey rides and framing a jockey challenge market.
The Jockey Analysis Tool “JAT” is part of the Statfreaks “Advanced Horse Racing Subscription Package.“
THIS TUTORIAL IS LEVEL

- Identifying a strong horse and jockey combination for upcoming rides.
- Understanding historical jockey patterns over different distance ranges and settling positions.
- Assist with jockey challenge analysis.
- Finding jockeys that may not be suited to their upcoming ride.
- Isolated horses that have good or poor statfreak ratings (SFR).
- Finding jockey’s that have targeted a specific ride at a particular race meeting.
Analyzing jockey’s can many different ways. Our approach is a sharp and simple one; we look into the history of a jockey and their rides, we categorize distance groups and settling positions and then identify upcoming opportunities that meet those historical criteria.
The Jockey Analysis Tool has a few definitions which need to be understood before continuing. The list to the right explains each column heading and how the table calculates each measure.
TABLE DEFINITIONS
| TABLE HEADING | DESCRIPTION AND CALCULATION |
|---|---|
| TRACK: | The upcoming track that the jockey will be riding in |
| RACE: | The number of the upcoming race that the jockey will be riding in |
| DIS TYPE: | The distance type of the upcoming race.
|
| RIDER: | The Jockey’s name |
| PREDICTED SETTLE: | The predicted settling position for the upcoming race that the jockey will settle in the race. Predicted at the 800-meter point
|
| RIDES: | Number of historical jockey rides used to produce the jockey data analysis table |
| WIN SR: | The historical win strike rate of the jockey matched with its upcoming “DIS TYPE” and “PREDICTED SETTLE” |
| PLC SR: | The historical place strike rate of the jockey matched with its upcoming “DIS TYPE” and “PREDICTED SETTLE” |
| MKT EDGE: | Market Edge. Calculated by
|
| NO: | The number of the horse for the upcoming ride. |
| HORSENAME: | The name of the horse that the jockey will be riding in the upcoming race. |
| LENGTHS: | The statfreaks rating “SFR” lengths value from the SFR rating report. |
| RNK: | The Rank of the SFR Rating for that horse/ride in the race against all other runners. Taken from the SFR Report. |
GLOBAL DATA FILTERS
| FILTER NAME | DESCRIPTION |
|---|---|
| HISTORICAL DATA |
|
| UPCOMING DATA |
|
| RIDES: |
|
| MKT EDGE: |
|
| LENGTHS: |
|
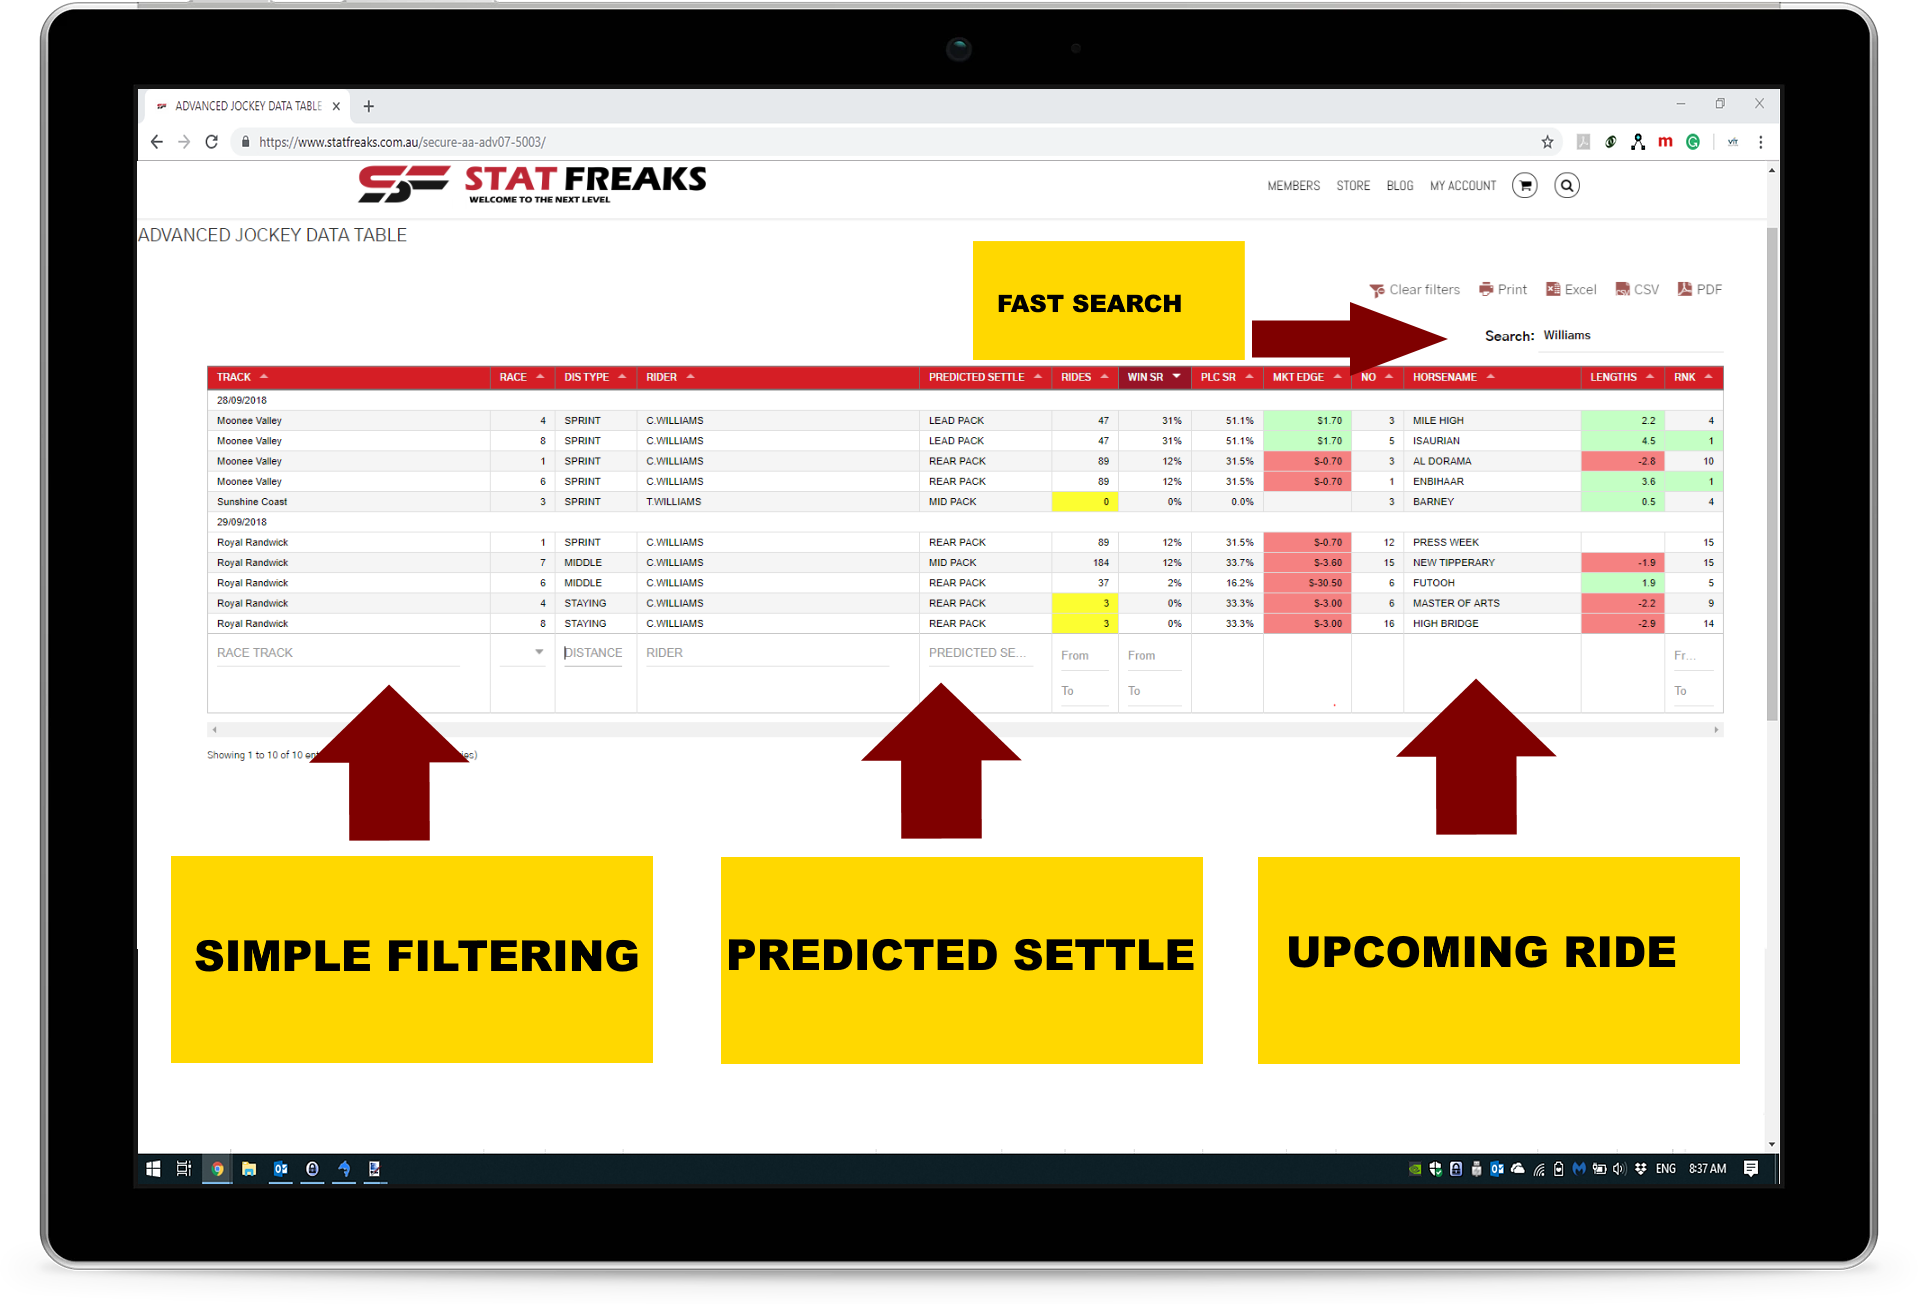
SEARCH
The Jockey Challenge Analysis Tool main search can be found at the top left of the table. This feature will search the entire data table for part or all of the wording typed into the area.
FILTERING
Filtering specific columns can be done by scrolling to the bottom of the table and entering or selecting your desired value. Columns such as race and distance groups have a pre-defined list, where tracks, strike rates, and ratings allow you to specify partial wording or range values.
PAGE NUMBERS
The Jockey Challenge Analysis Data Table only shows 25 rows per page; this is to allow for improved loading speed and to allow for a maximum of up to 24 horses listed on a single page. To move forward and backward between pages, use the arrows located at the bottom right corner of the jockey analysis table.


SORTING
Each column in the jockey challenge analysis tool can sort in descending and ascending order. To sort, click on the small arrow located at the top of each column.

EXPORT TO SPREADSHEET
Exporting to a spreadsheet can be done by clicking the EXCEL or CSV icon at the top right of the table. It is recommended to have your search and filters set before using the export function. Export will only extract the data that is on the page displayed.
WHY EXPORT?
Exporting the jockey challenge analysis table to a spreadsheet allows you to save your analysis work to your desktop. You can then combine it with your analysis, add prices and track your investments.


Printing the Jockey Challenge Analysis Table can be achieved by clicking the print icon at the top right of the table. Printing can be useful if you would like a physical copy of your analysis to take to the races.
Clicking the PDF button will export the jockey challenge analysis table to your computer in a pdf file format.
CLEAR FILTERS
Clicking the “Clear Filter” icon will reset the entire jockey challenge analysis table back to its default setting with no filters applied. Be sure to export your analysis to spreadsheet or pdf before clicking the “Clear Filter” button.
