
HOW TO READ AND UNDERSTAND OUR STATFREAKS GREYHOUND RATINGS REPORT
Last Updated: August 2020
- List of August 2020 updated: Greyhound Rating and Statistics Service Update – August 2020
1) Track and Date
- All our Statfreaks Greyhound Rating Reports will display the track name and date on the front page.
2) Top rated runner in from each race
- The Greyhound Rating report will show the Top rated runner from each race within the report meeting.
3) Difficulty Level of Report
- On each Greyhound Rating report, you will find a graphic which displays its difficulty level. Advanced difficulty level items are part of our premium subscription products and provide detail insights and analysis.
- To view, all entire range of SF rating products click HERE

1) Date, Track, Race Number & Distance
- All our SF Rating Reports will display the Date, Track, Race Number and Distance
2) Speed Map
- Predicted speed maps produced by our advanced predictive algorithms display in the direction of how it would appear from a camera angle watching on broadcasting vision. The larger the bar, the faster the greyhound is out of the box
3) List of Runners with Star Rating System
- List of all runners, sorted in box order with 1 being the inside box.
- Star Rating Indicator
4) Statfreaks Ratings (Early and Overall Speed)
- Advanced STATFREAKS ratings measured in lengths and ranks for each runner.
5) Predicted Commentary
- STATFREAKS predicted commentary generated from our advanced predictive algorithms
6) Box Strike Rates (Rolling)
- A table with a breakdown strike rates for all box’s at track and distance, and favorites.
7) Field Quality Rating derived on benchmarking speed.
- Calculated quality of runners in the field derived from our SFR Rating.
8) Data Quality Rating
- Quality of data to produce this report. Our recommendation is to tread cautiously for races not equaling 100%

- ES: EARLY SPEED RATING
- The ES is a critical measure which displays how fast a greyhound can jump out of the box. This measure has been carefully studied and fine-tuned over the years and is becoming more accurate as our algorithms continue to learn.
- ESR: EARLY SPEED RANK
- The early speed rank provides a ranking for that specific race based of the ES value. Rank One (1) represents the greyhound with the fastest predicted early speed.
- ECI: EARLY COLLISION INDICATOR
- Our Early Collision Indicator was introduced to help identify if a greyhound is at risk of closing in on the inside greyhound when first jumping out of the box. If a greyhound has a similar early speed as its inside dog, this usually is a good indicator to predict a collision as they approach the first bend.
- SFR: STATFREAKS RATING
- The STATFREAKS Greyhound Rating (SFR) is made up of over 50+ variables which we have developed and optimized over many years. Each variable has a specific weighting of importance coming into each race. Our predictive analytic algorithms continuously adjust these weights as it continues to learn over time.
- As we are constantly analyzing data and learning new things, new variables are constantly added to our back end database. Our advanced system automatically decides how important, or not for each race.
- RK: RACE RANK (SFR)
- The SFR rank provides a ranking for that specific race based of the SFR value. Rank One (1) represents the predicted highest rated greyhound for an upcoming race.
- RKT: MEETING RANK (SFR)
- One of the most powerful measures available across all our racing ratings, the “RKT”. This value, is the rank of a runner in a race, ranked against all runners on the day for a specific meeting.


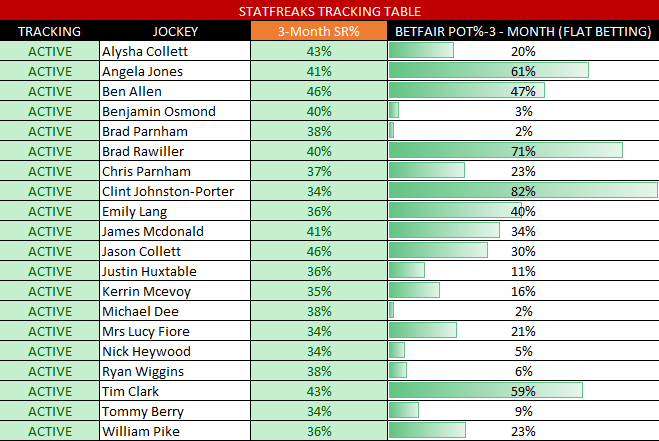
Rider/Trainer & Combo – Statfreaks Rating Tracking
Last Updated: 3rd October 2024. At the end of each month, we identify the top jockeys and trainers based on our detailed data analysis. These are individuals who have consistently demonstrated exceptional strike rate [...]
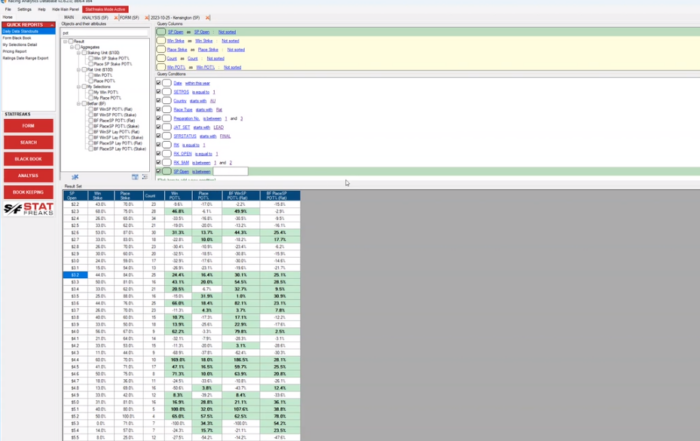
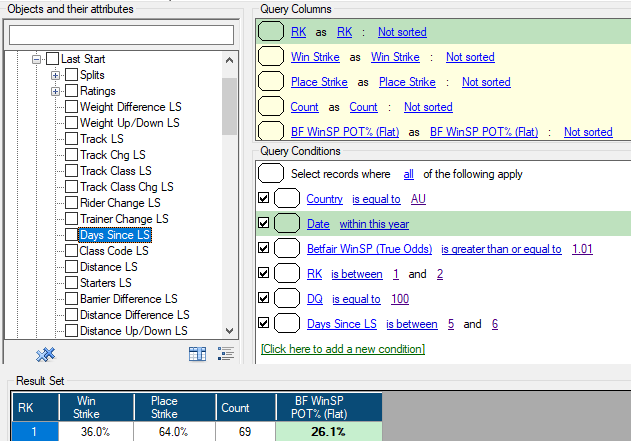
Quick Backup Horses Performance Analysis
In the dynamic world of horse racing, every day counts. Understanding how a short backup of just 5 or 6 days impacts a horse's performance can yield valuable insights for trainers, punters, and industry [...]