There will come a time when every professional horse racing form analyst will need to use Microsoft Excel to work with data. Horse Racing Excel data files can be created, downloaded or purchased from various data sources on the web. To work with horse racing excel data files, you need Microsoft Excel installed and licensed.
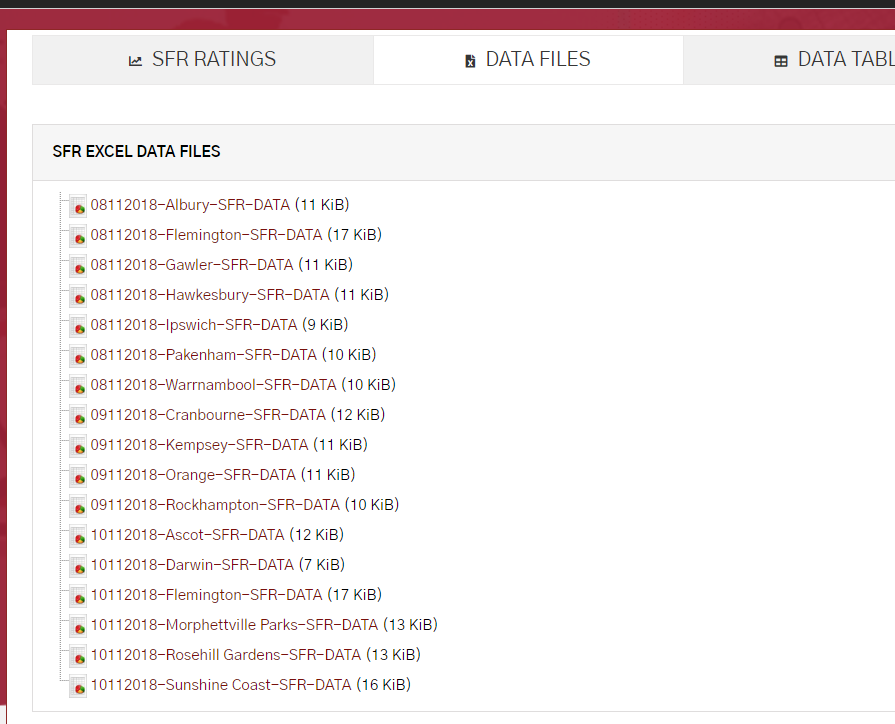
STATFREAK’S Horse Racing Excel data files are available for each upcoming horse race meeting as part of the horse racing subscription package.
THIS TUTORIAL IS LEVEL

Requirements:
- Microsft Excel 2010 or newer
- Downloaded Horse Racing Excel sample data via from statfreaks
* Searching for more FREE data files?. Register for free at www.statfreaks.com.au/register to download more!
- Understand the basic’s of horse racing excel data.
- Learn how to sort, filter and add conditional formatting to excel files.
- Find value in horse racing excel data.
- Estimated Tutorial Time: 30-60 minutes
We now have two video’s available covering this tutorial for both Greyhound and Horse Racing. Links provided below.
Videos were added to this guide on the 8th of June, 2020.
There are different levels of horse racing excel files available across the web, free, mid-tier and premium. You can download results, upcoming form, sectional timing and rating’s horse racing excel files and store them on your computer for personal use.
What’s so good about excel?
Analyzing horse racing excel data allows you to calculate, adjust, fine tune and save data. If you find yourself spending hours with printed out horse racing form guides, notes, comments and then trying to go back and perform any analysis then its time to make the investment and learn how to work with data in excel. Horse racing excel data can be used at a basic level for viewing, filtering and saving to very advanced degrees with automated calculations and advanced algorithms.
Before we begin, please download the horse racing excel data sample provided in this tutorial. Once download, open the file on your computer. The sample data provided is a STATFREAKS horse racing excel rating data file which comes with any statfreaks horse racing subscription.
Ok, you’re now ready. Let’s begin.
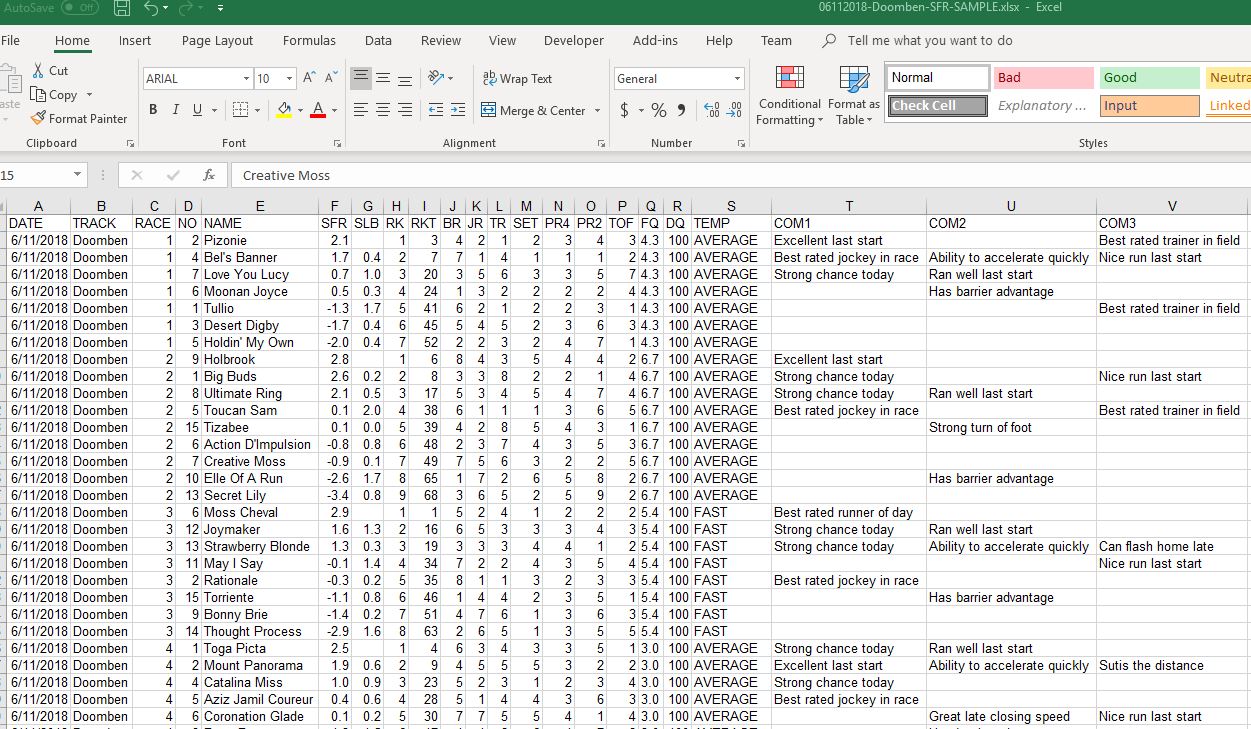
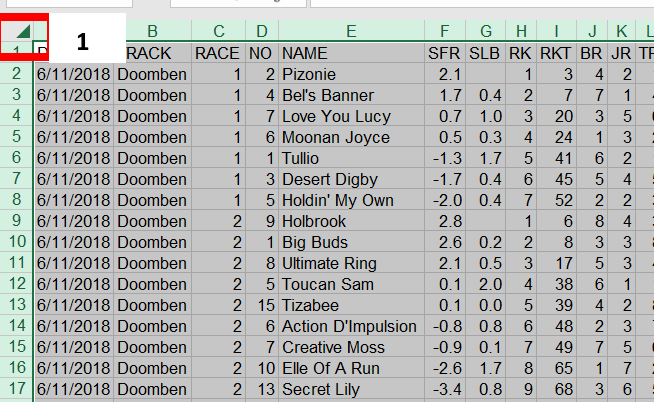
Once you have successfully downloaded the statfreaks Horse Racing Excel data file, open it up by doubling click the file. All, the raw data and columns displayed are from 6/11/2018 Doomben race meeting.
The horse racing excel data file sample contains heading’s on row “1” which describes the data for each column. Please refer to the “Horse Racing Excel Data File Glossary” article for a detailed description of each column.
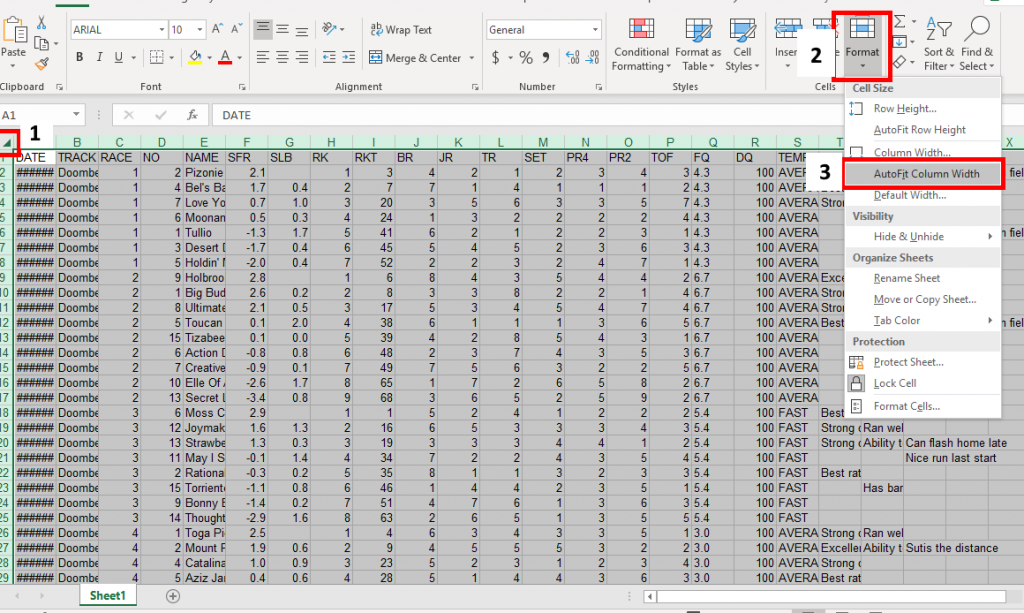
An essential step before working with horse racing excel data is to ensure you can read the data. Excel has this great feature called “AutoFit Column Width” which adjusts all the columns to the right width to display data.
Step 1:
- In the top right of the data grid, click on the “down-wards pointing arrow.”
- All the data cells will highlight.
Step 2:
- Locate and CLICK the “Format” icon located in the top ribbon of excel.
- A menu will appear with options
STEP 3:
- Select “AutoFit Column Width” from the list
Your columns will now be adjusted to display all the horse racing excel data correctly.
STEP 1:
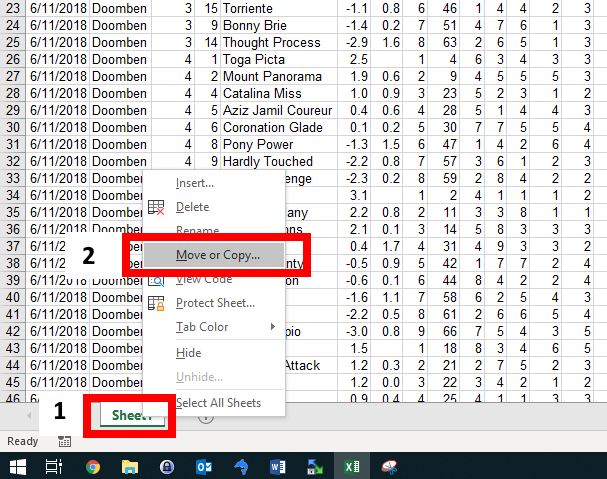
- With your mouse, RIGHT click on the excel sheet “Sheet 1“
- A menu will appear, move your mouse up and over “Move or Copy“
STEP 2:
- LEFT click on “Move or Copy“
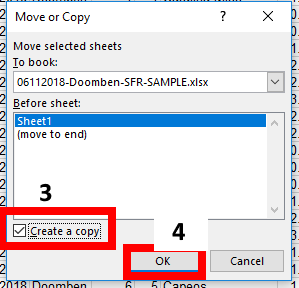
- A small “Move or Copy” window will appear.
STEP 3:
- Make sure “Create a copy” is ticked.
STEP 4:
- Click “OK“
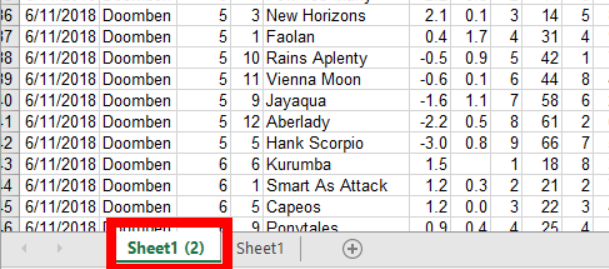
Once successfully copied a sheet with the name “Sheet (2)” will appear. You can rename this sheet by “RIGHT” clicking on the sheet, and selecting “Rename” from the menu. For this horse racing Excel tutorial, we will rename it to “SORT01”
You have now successfully learned how to clone an excel data tab. Please proceed to the next section.
Sorting is one of the most used features in Microsoft Excel. When it comes to horse racing excel data, it can help zone in on some potentially good horses. Excel has two types of sorting functions, ascending and descending. Ascending is when values sort from smallest to largest, e.g., 1,2,3,4,5,6 and so on. Descending is the opposite, where numbers classify from largest to smallest, e.g., 99,98,97,96 and so on.
Ok? So why is this so important when it comes to working with horse racing excel data? Let’s take the example that in our sample rating file we are looking for horses that will “Lead” when settled in the running. You may want to quickly identify all the horses across the entire race meeting for the day in each race and use them in an in-play betting strategy on Betfair. Now, if you had to do this manually, you would be clicking or browsing through some form guide or speed map in a website trying to identify each runner and who will lead in each race. In the sample horse racing excel data file, within a few seconds, you can sort by the “SET” data column that contains all the predicted settling positions of each runner. Yes, that’s right in a few seconds you have a list of runners across the entire meeting that are lead runners.
Sounds too good to be true? Well, let’s get to it and complete the steps together.
STEP 1:
- To the top right-hand corner of the excel data grid, “LEFT” click on the arrow pointing down and to the right.
- The entire horse racing Excel data sheet will highlight.
STEP 2:
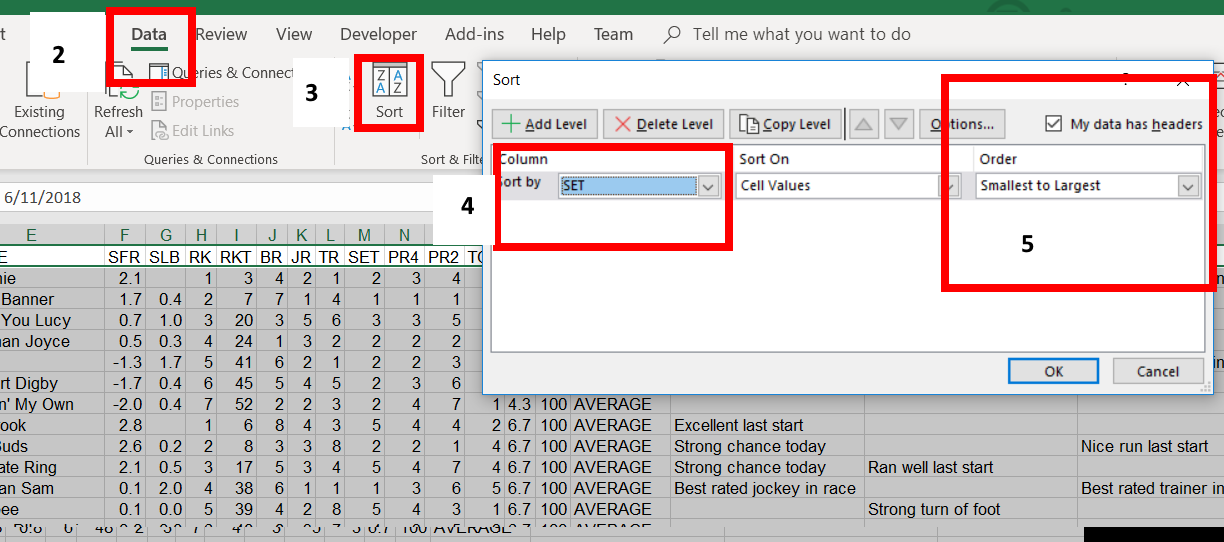
- “LEFT” click on “Data” ribbon located at the top of Microsoft Excel.
- The display ribbon will display a new set of tools available for use.
STEP 3:
- “LEFT” click on the “Sort” Icon located in the set of tools.
- A “Sort” window will pop up.
STEP 4:
- In the “Sort by” drop-down select, “LEFT” click to display a list of all headings
- Locate “SET”
- If you do not see any headings in the drop-down list, please ensure “My data has headers” is ticked in “STEP 5“, then return and complete “STEP4“.
STEP 5:
- Make sure “My data has headers” is ticked
- Set the “Order” drop-down to “Smallest to largest” (To sort the lead horse being one as a leader)
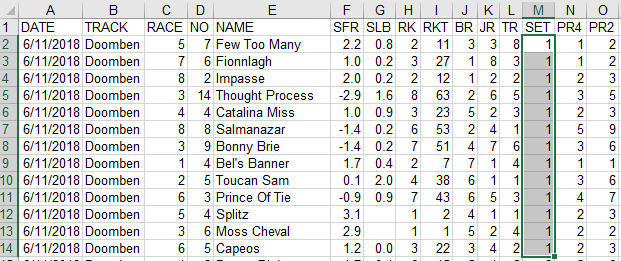
You now have learned how to sort data columns with horse racing excel data. Feel free to sort by other columns and further explore.
Don’t forget to save you horse racing excel file as you work. To save, click the “File,” then “Save” or “Save As” button in excel.
STEP 1:
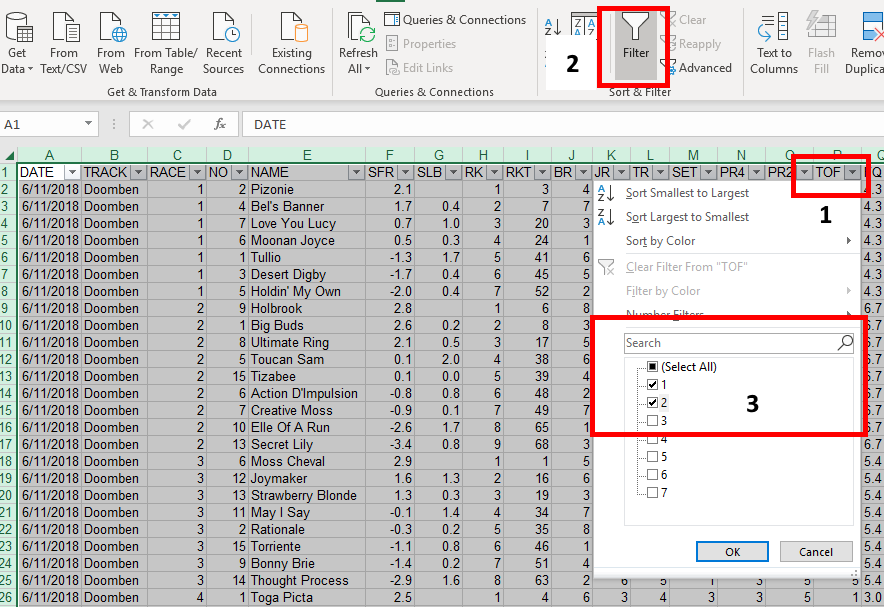
- Ensure excel is still on the “Data” ribbon which we selected in the sorting section.
- Click on cell “P1” which has the heading “TOF.”
STEP 2:
- With the “Data” ribbon selected at the top of Excel, click the “FILTER” icon which looks like a funnel.
- Notice, all the headings in row 1 now have a small downward pointing arrow.
- Click on the down arrow on cell “P1” – “TOF.”
- A filter menu will appear
STEP 3:
- We only want to filter on horses thank rank 1st or 2nd with the “Turn of Foot” variable, In other words, which two horse are the fattest when asked to accelerate.
- In the menu, ensure numbers 1 to 2 are checked, and all others are unchecked.
- Click “OK”
The horse racing excel data set will now display only the horses that are ranked 1st or 2nd for the “Turn of Foot” variable.
Apply the same filter to column “PR2” (Predicted Position at 200m)
STEP 1:
- Click on the down arrow in cell “O1” which has the heading “P2.”
STEP 3:
- The filter selection menu will appear. Ensure values 1 to 4 are checked, all other numbers leave unchecked.
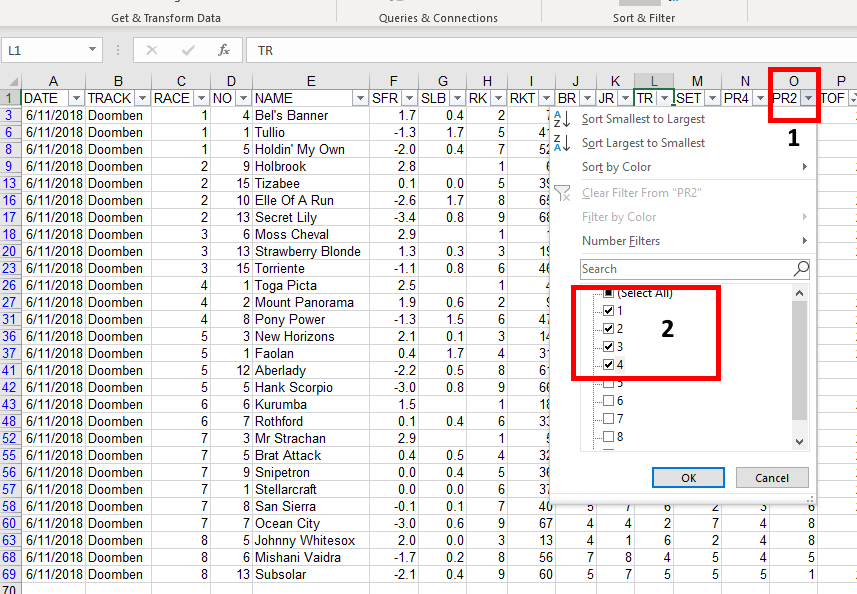
Apply the same filter with values 1 to 4 to the following columns
PR4: Predicted Position in-run at 400-meter point
SET: Predicted Settling Position
TR: Trainer Rating Rank
JR: Jockey Rating Rank
RK: STATFREAKS Rating Rank.
You should be left with three runners from the horse racing excel data file. Number 6 “Moss Cheval” in Race 3 profiles solid with the data ranked one in the race and ranked one on the day over the entire meeting.

Filter Settings Applied:
TOF: 1-2
PR4: 1-4
PR4: 1-4
SET: 1-4
TR: 1-4
JR: 1-4
RK: 1-4
To make things easily identifiable to the human eye, excel has this great feature called “Conditional Formatting.” It allows a user to set colors to different excel cells based on a range or specific value. Conditional formatting is a handy feature for horse racing excel analysis because it can highlight highly rated runners in green, and low rated runners in red. Colour coding helps identify strong and weak lines of data for horses. Let’s format some excel data lines
- Colour code horses with green where the value is ranked 1st
- Colour code horses yellow ranked between 2nd and 3rd.
How to select a cell range to conditional format.
In the next few steps, we will color code green the horses that have a rank value of “1” for a variable over multiple columns.
Step 1:
- Hold down “SHIFT” on your keyboard (Do not release it)
- Click on “J.”
- With “SHIFT” still being held down, Click on “P.”
- Columns “J” to “P” will highlight.
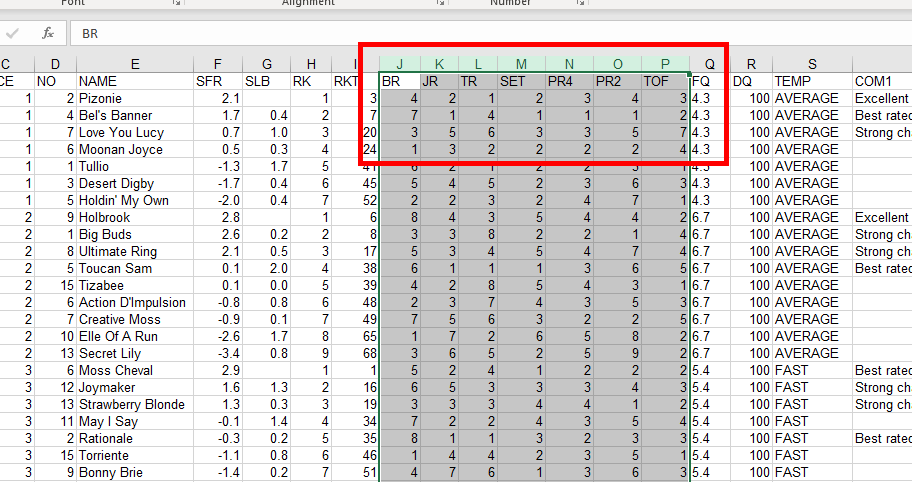
Color coding ranked “1” values Green.
Step 1:
- Release the shift “SHIFT” key on your keyboard.
- Locate and click the “Conditional Formatting” Icon.
Step 2:
- Select “Highlight Cell Rules”
Step 3:
- Select “Equal To”
- A pop up window will appear
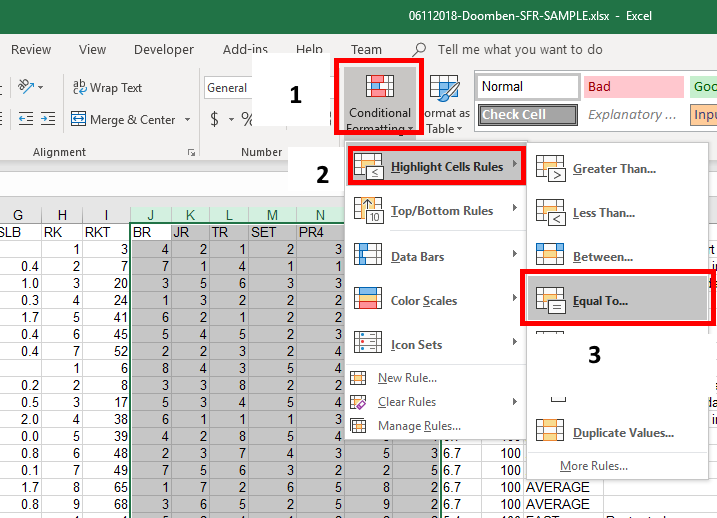
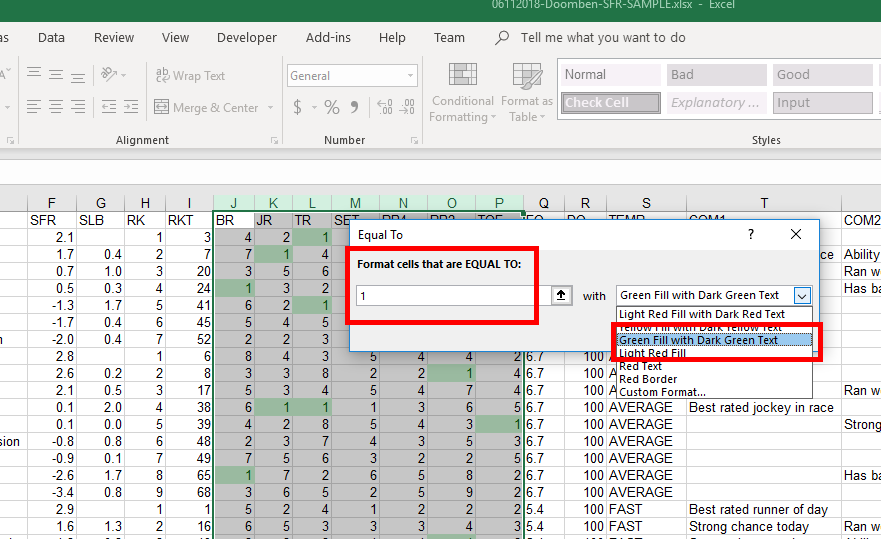
Select the following settings:
- Enter “1” into the “Format Cells that are EQUAL TO:”
- Select “Green fill with a Dark green text”
- Click “OK”
All the cells with value “1” (Ranked 1st) will be highlighted Green.
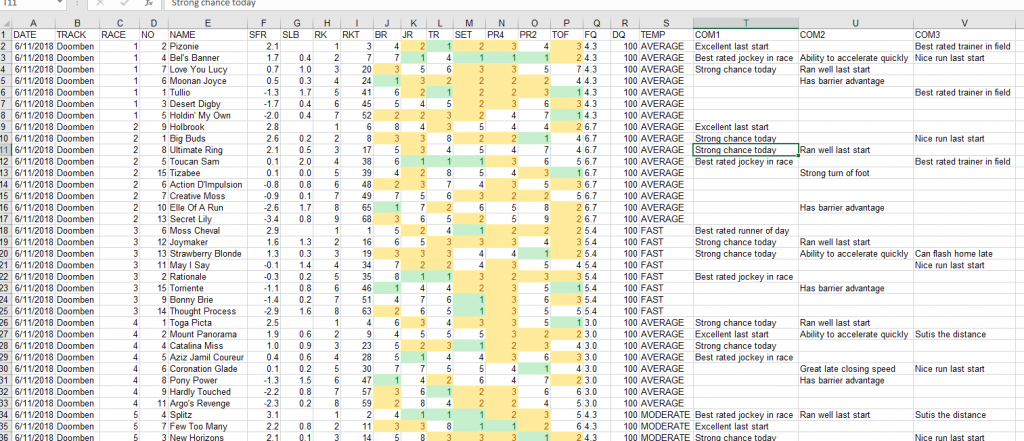
Repeat the steps for color coding values “2” and “3” and color code them “Yellow”
Your horse racing excel data sheet should now be color coded with
“1” Ranked Values = Green
“2” and “3” Ranked Values = Yellow
Working with horse racing excel data you can the calculate data quickly. Excel Formula’s are handy especially if you know there is a bias at a particular track. For example, a few races have gone past, and you have identified that there is a leader bias and want to combine a horses settle position with its overall rank. Let’s walk through the steps.
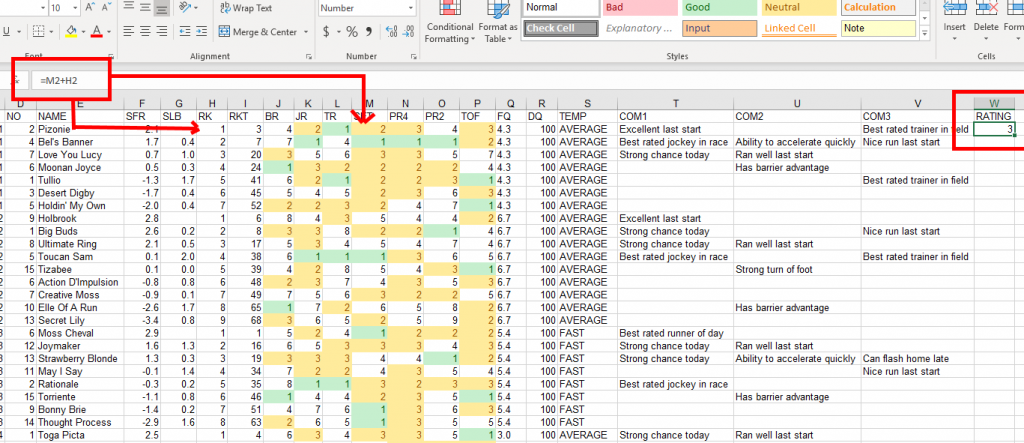
Creating a formula to combine Settling Speed and SFR Race Rank
STEPS:
- Click on cell “W1”. Type in “RATING” which will be the heading of the new columns
- Click on cell “W2”. Type in “=” (This is the equals sign on your keyboard)
- Once equal’s in typed in, excel turns in selection mode which allows you to select the cells to combine
- Click on cell “M2”
- Press “+” on your keyboard (Located on your number pad to the right)
- Click on cell “H2”
- Press Enter
- Cell “W2” will now be displaying the Settling value plus the Rank value, in this case, it was “3”
Automatically fill down the formula for the whole horse racing excel data set
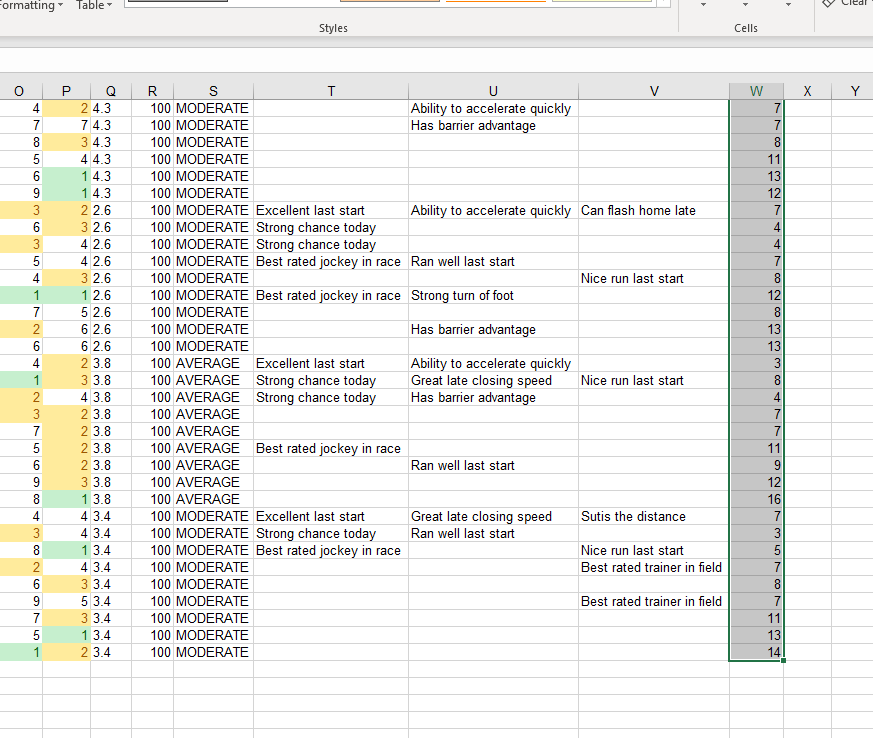
Excel can automatically apply the same calculation formula for the remaining rows quickly and adjust the referring cells to work with the correct row.
STEPS:
- Click on cell “W2”
- Press “SHIFT” on your keyboard. (Do not release it)
- Press and hold the “DOWN” key on your keyboard
- The screen will slow down, hold it until you get to the very last row of data
- If you go too far, press the “UP” key to move up slowly until you read the last line
- Release all key’s on the keyboard
- Press “CTRL” and “D” together on your keyboard to fill down
- Excel will auto calculate each row
You have now successfully created a formula in your horse racing excel data file. Save your work and move onto the next step.
Adding results to your horse racing excel data file.
Using all functions completed earlier in the tutorial, follow the below steps.
STEPS:
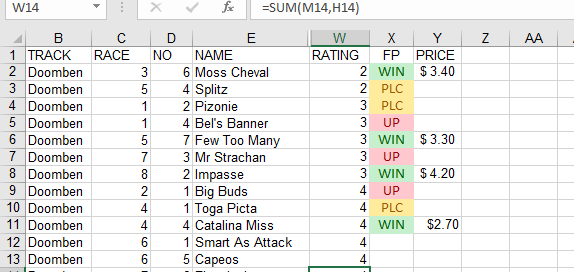
- Sort your data set by the “RATING” column “W” from smallest to largest.
- Create two new columns, “FP” and “PRICE.”
- Visit your favorite website which has finishing positions and prices.
- https://www.odds.com.au/horse-racing/ is a good start.
- For each horse in the Top 10, populate its finishing position and price.
If you followed this exercise correctly, the following result should occur
- 10 Selected Horses
- 4 Winners
- 7 Placed
- 3 were unplaced
- $13.6 dividend returned
Therefore, if you bet $10 on each horse in the top 10, you would have invested $100, returned $136 and made a $36 profit.
Practice and patience bring confidence and clarity. You can perform the steps in this horse racing excel tutorial on any excel data file, including the STATFREAKS horse racing excel data rating files available with our subscription. We have only touched the surface on what Excel has to offer.
In the not too distant future will be creating some further tutorials covering
- Create advanced formula’s and totals
- How to calculate rated prices with horse racing excel data
- Automated excel with macro functionality.
We hope you have enjoyed this tutorial on horse racing excel data. Please feel free to make contact if you have any questions or feedback
Regards
David Vitali
The Orginal Freak
