
This article outlines all the variables and data structure’s within our horse racing excel data files.
Statfreaks Horse Racing Ratings Excel data files provide further insight into each runner and allow you to further filter, analyze, and zone in on potential value.
You can save the horse racing excel data files to your local computer, update with results, prices and your staking amounts and import into a local database for record keeping purposes.
* Searching for more FREE data files?. Register for free at www.statfreaks.com.au/register to download more!

The Horse Racing Excel data files are available for
- Each upcoming horse race meeting as part of the Horse Racing Subscription Package.
The “Data Model Tracking” (DMT) column was introduced to track historical variable combinations with a strike rate of 30% or greater and ranked within the Top four runners for that meeting. Within each upcoming PDF and CSV file we provide a few indicators to identify when our system has identified these selections.
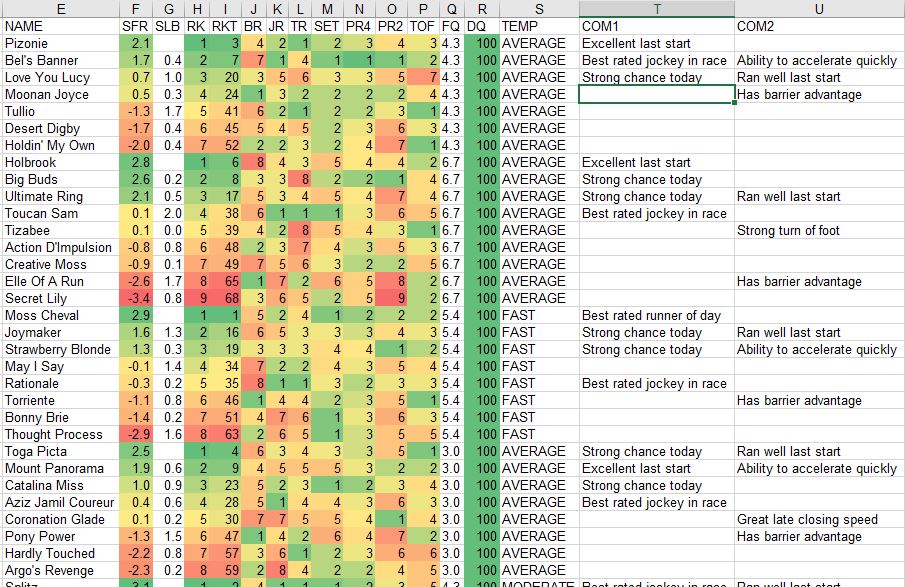
CSV FILE: Within the CSV file, the DMT Column will have a “x” displayed when that runner matches the historical 30% or greater variable profile, and is ranked within the top 4 runners for that meeting (RKT = 4 or less)
PDF REPORT: Within the PDF report, we have introduced a new comment under the “Commentary 3” area. When a runner’s variable combination lines up with 30% or greater historical win strike rate profile and ranked within the top four runners for that meeting, the comment “Strong in our data models” will appear.
The DMT variable will only be available on the day of the event, therefore its best to obtain the latest CSV file, and PDF the same day the meeting is ran on, to have visibility of the DMT indicator.
The PDF report does not always show “Strong in our data models” as it is mixed with other commentary, therefore it is always best to check the CSV to obtain all data model tracking indicators on the day.
The DMT was introduced on September the 8th, 2020 and will be tracked going forward.
Using our data variables, the statfreaks system generates commentary, which is displayed on the PDF reports, and inside the excel CSV horse racing ratings data files. These comments can be used to quickly identify runners which have strong historical variables, and/or possess strong predicted upcoming variables.
COMMENTRY 1
- Best rated jockey in race
- Best rated runner of day
- Excellent last start
- Not enough historical data
- Predicted to lead
- Strong chance today
COMMENTRY 2
- Ability to accelerate quickly
- Great late closing speed
- Has barrier advantage
- HWS: %, MWP: %
- HWS: Historical Strike Rate – Located in commentry 2, Historical Strike Rate for combined RK/RKT value, 25% and over displayed for a selected runner
- MWP: Minimum Win Price – Located in commentry 2, The minimum market price to take for selected runner, based on 130% market
- Ran well last start
- Strong turn of foot
COMMENTRY 3
- Best rated trainer in field
- Can flash home late
- Nice run last start
- Suits the distance
- Strong in our data models
-
- We receive new data every few hours. Therefore, the algorithms re-run every night.
- We occasionally receive some late sectional data which may shift a single horse up or down. Therefore all the other horses SFR will get adjusted as the SFR is an in race rating.
- If we release a report early, the 10-11am version can be different from earlier versions due to
- We have received some data from the previous days rides from a jockey, which alters the jockey ratings. E.g. D Oliver might have had six rides the day before, that will get adjusted and re-calculated.
- There is a late rider change.
- A tactic change, the horse will be ridden more forward.
- We receive new data every few hours. Therefore, the algorithms re-run every night.
-
- CONDITION OF TRACK
- Only what was available 48 hours prior. E.g. if it is Thursday night, and the weather for Saturday suggests it will be dry then the variables are adjusted to use dry weather variables.
- BARRIERS:
- Yes. For more info, please visit the following link: Barrier Advantage Calculation FAQ
- DISTANCES: Yes. Our algorithms contain variables which factor in distances switches.
- BREAKS/SPELLS: Yes. Our algorithms consider the days between runs and spells.
- CONDITION OF TRACK
Our SFR data calculates barrier advantage by reviewing accurate historical sectional timing data and converting the lengths lost for each horse that begins from each barrier. For example;
- Barrier 1 at Caulfield has average 1.9 lengths losing margin from the winner, and barrier 2 at Caulfield an average of 1.4 lengths from the winner, we would then rate barrier 2 higher than barrier 1 as on average it has a smaller losing margin from the winner.
- Our systems process this logic for all barriers at every track and distance, and then factor’s it into the SFR rating on the day.
Why do we do this? Our internal calculations over the years have shown us that this is a more accurate way to measure barrier advantage than strike rates. Further to this, it allows us to see which staring barriers have an advantage with assisting a horse hustling into position at the 800,600,400 and 200-meter points.
Yes, we use the most accurate sectional timing data available on the market to ensure our algorithms and learnings are as precise as possible. All horse racing ratings and analysis is completed using data provided from Daily Sectionals. If you are interested in obtaining sectional data for your analysis, please visit

Horse Racing Excel Data File Glossary – Updated 2022
This article outlines all the variables and data structure's within our horse racing excel data files. Statfreaks Horse Racing Ratings Excel data files provide further insight into each runner [...]
SFR Horse Racing Ratings Report: How to Guide-Updated 2020
HOW TO READ AND UNDERSTAND OUR STATFREAKS HORSE RATING REPORT COVER PAGE 1) Track and Date All our SF Rating Reports will display the [...]
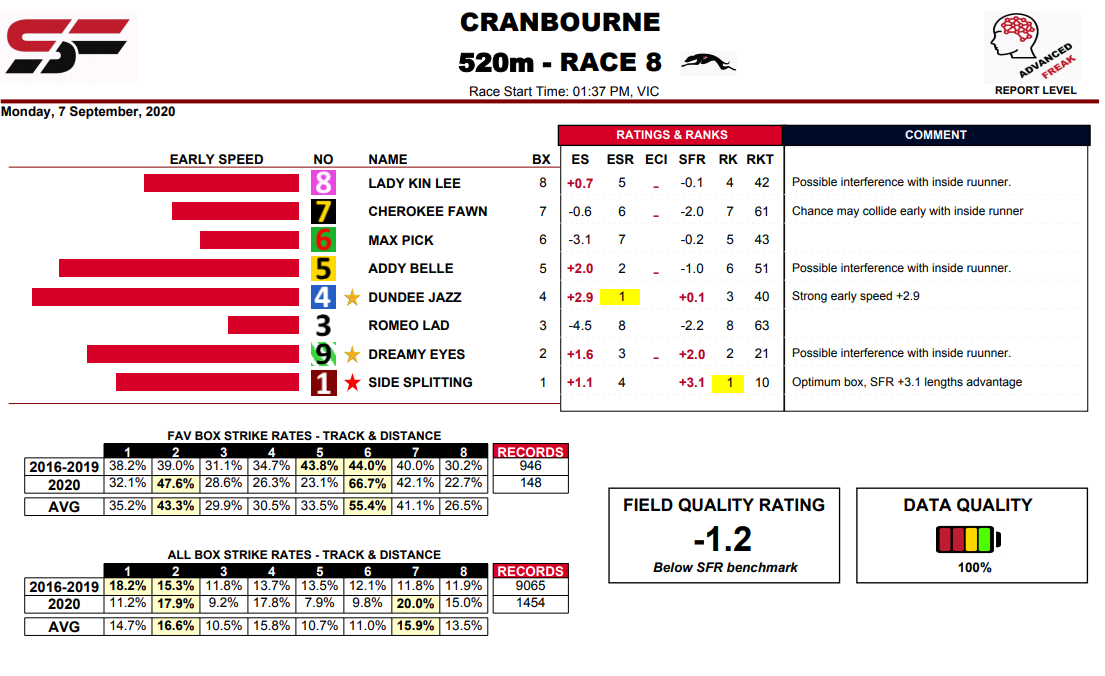
SFR Greyhound Ratings Explained – August 2020
HOW TO READ AND UNDERSTAND OUR STATFREAKS GREYHOUND RATINGS REPORT Last Updated: August 2020 List of August 2020 updated: Greyhound Rating and Statistics Service Update – August 2020 [...]