
This analysis is a focus on just horse racing statistics and excludes any other external factors and variables.
Focusing on just horse racing statistics can have its advantages as it can provide clarity and confidence in the historical horse racing data you are working with. Furthermore, it can assist you whilst completing your horse racing form analysis of future races. This analysis explores some essential statistics across Moonee Valley races using horse racing sectional timing data supplied from Vince Accardi at dailysectionals.com.au.
Now, focusing on just horse racing statistics for Moonee Valley races, let’s dive into it.
Looking to enhance your analysis skillset? Check out the following articles
THIS ANALYSIS LEVEL IS

What we used to complete this analysis:
- Sectional Timing Data: dailysectionals.com.au
- Racing Analytics Professional Database: racinganalyticspro.com.au
ANALYSIS PURPOSE
- Explore key statistics for Moonee Valley Races
- Last 800, 600, 400 and 200-meter positions.
- Sprint, Middle and Distance Races.
TABLE OF CONTENTS
* Searching FREE horse racing data files and virtual data tables?. Register for free at www.statfreaks.com.au/register to download!
With the focus on just horse racing at Moonee Valley races, let’s quickly cover over what horse racing data we imported and which horse racing report we executed from RAPRO.
- Daily Ranking – Daily Sectionals Excel files
- Sectional Review – Daily Sectionals Excel files
- DAS – Statistical Track Analysis – RAPRO report we ran to retrieve the Moonee Valley races statistics
Once we obtained all the data files, we placed them in the RAPRO folder on the desktop. From there we opened the RAPRO software, clicked the import button and waited a few seconds for the software to convert and import each data file into the back end SQL database. RAPRO came with some data status reports which allowed us to view all the Moonee Valley races loaded into the system.
RAPRO did have various other reports such as advanced horse search, historical sectional and ranking analysis and top performance reports. For this analysis, we utilised the “Statistical Track Analysis” report only. What we also liked about RAPRO was the ability to connect directly into the back end SQL database and execute custom queries and browse the data tables.

Continuing our journey of focusing on just horse racing statistics on Monee Valley races we began looking at the position-in-run at each key point being the 800, 600, 400 and 200-meter points.
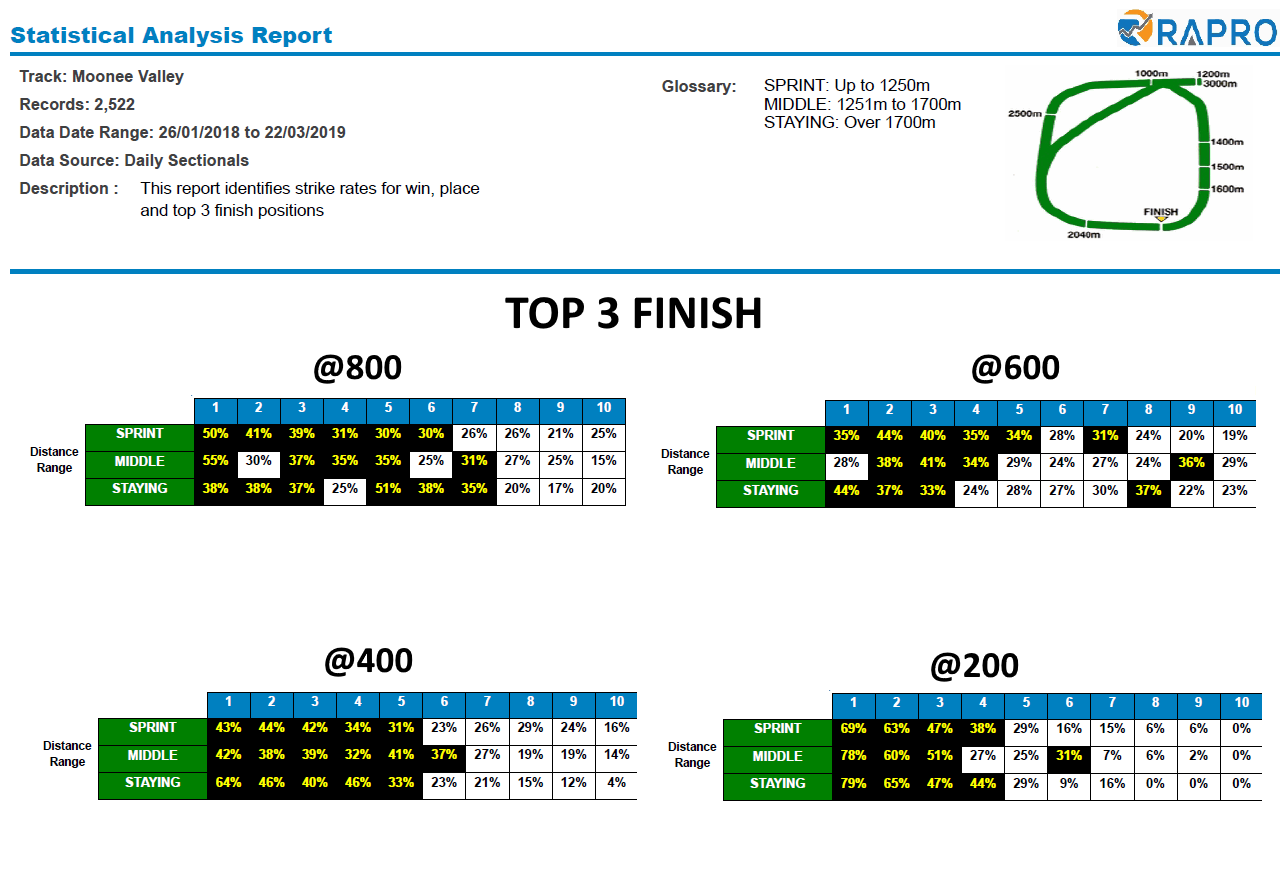
800 Meter Point
The statistics at the 800-meter point for Moonee Valley races return some exciting results.
- Leading in sprint races has the most advantages across sprint and middle distances races.
- In staying races, leading is not as advantages compared to sprint and middle distance races
- A horse leading in a sprint race chance is at 50% of finishing top 3.
- Leading in a middle distance race finished 55% of the time in the top 3
600 Meter Point
The statistics at the 600-meter point for Moonee Valley races return the following results.
- In spring races, the horses in positions 2,3 and 4 have higher strike rates to finish in the top 3 than the leader.
- This is also valid for middle distance races
- For staying races, the lead horse at the 600 has the highest strike rate to finish in the Top 3
- The highest strike rate to finish in the Top 3 is 44%, for horses that are leading in staying type races.
400 Meter Point
The statistics at the 400-meter point when focusing on just horse racing statistics at Moonee Valley races returns the following key figures.
- 64% of the time the leader will finish in the top 3 at the 400-meter point.
- All race distances have a strike rate of over 40% for leaders to finish in the top 3.
- Positions 2-3 (on pace positions) are consistent and all over 38% to finish in the top 3.
200 Meter Point
The statistics at the 200-meter point for Moonee Valley races returns the following.
- Both middle and staying distances races have a strike rate of over 78% to finish in the top 3.
- No horse has finished top 3 when positioned 10th at the 200-meter point.
- Staying race has the highest strike rate to finish in the top 3 at 79%
- Sprint races have the lowest out of the 3 distances types, at 69%
Concluding our analysis on just horse racing statistics for Moonee Valley races, the data suggests that it is more difficult to run down the lead horses as the race distances increases.
How we came up with the theory?
Taking a closer look at the 400-meter point statistics, we can see that the strike rate for leading horses in staying type races is 64%. Between positions two and four, there is not much of a variance in comparison to leading horses. In a staying type race the horses are running at a slower pace when running to the finish post, and are not able to catch up to the leader as fast as they would have in the middle or sprint distance race types at Moonee Valley. Running at a slower pace would require further distance to make up ground, and at Moonee Valley races the sharp bend before the straight is around the 400-meter point.
The above theory can further be supported by the figures in the middle distance range, where a similar pattern exists although not as dominant. Finally, sprint races also confirm that at Moonee Valley Races, the shorter the distance, the easier it is to make up ground and finish in the Top 3, which makes sense the faster a horse is running, the more ground it can make up in a shorter amount of distance, and time.