
HOW TO READ AND UNDERSTAND OUR STATFREAKS HORSE RATING REPORT
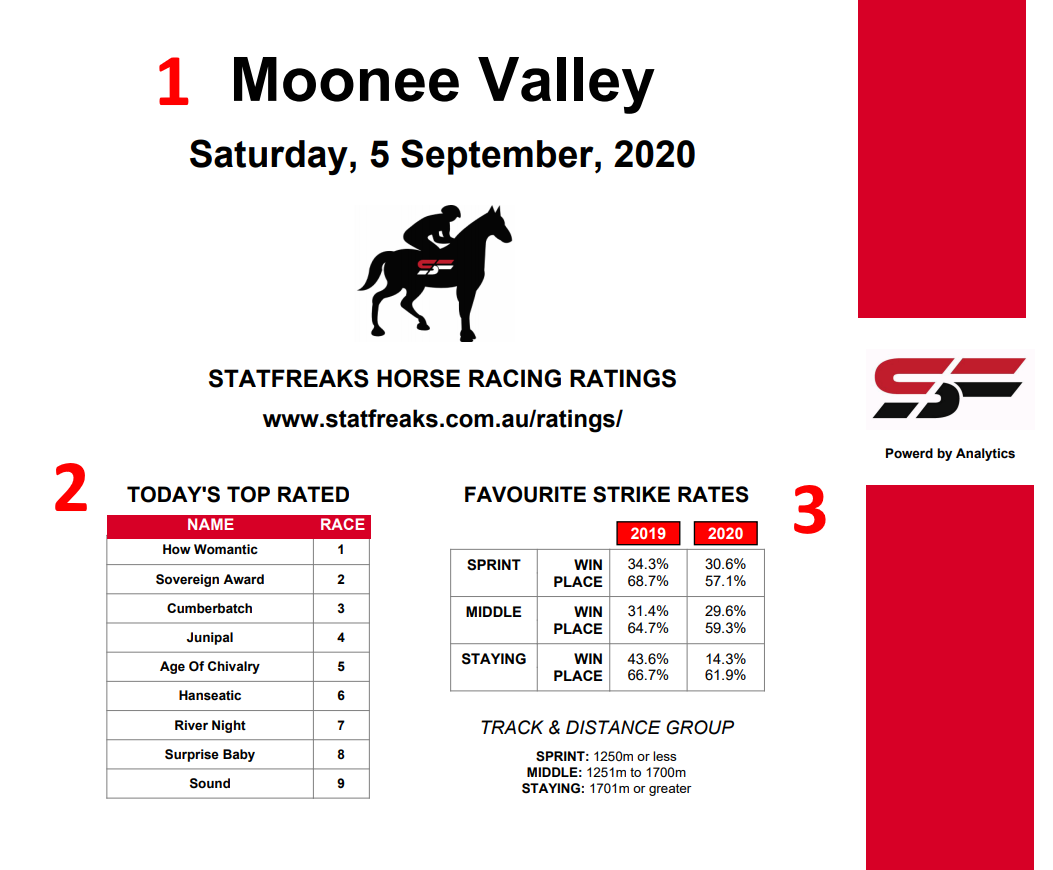
1) Track and Date
- All our SF Rating Reports will display the track name and date on the front page.
2) Top rated runner in from each race
- The SF Rating report will show the Top rated runner from each race within the report meeting.
3) Favorites Statistics (Year on Year)
- The cover page c0ntains a breakdown of horse racing statistics for favorites across three distance groups
- Sprint: Up to 1250m races
- Middle: 1251m to 1700m races
- Staying: 1701m or greater
- Win and Place Strike rates are displayed
- Current Calendar Year vs Previous Year.
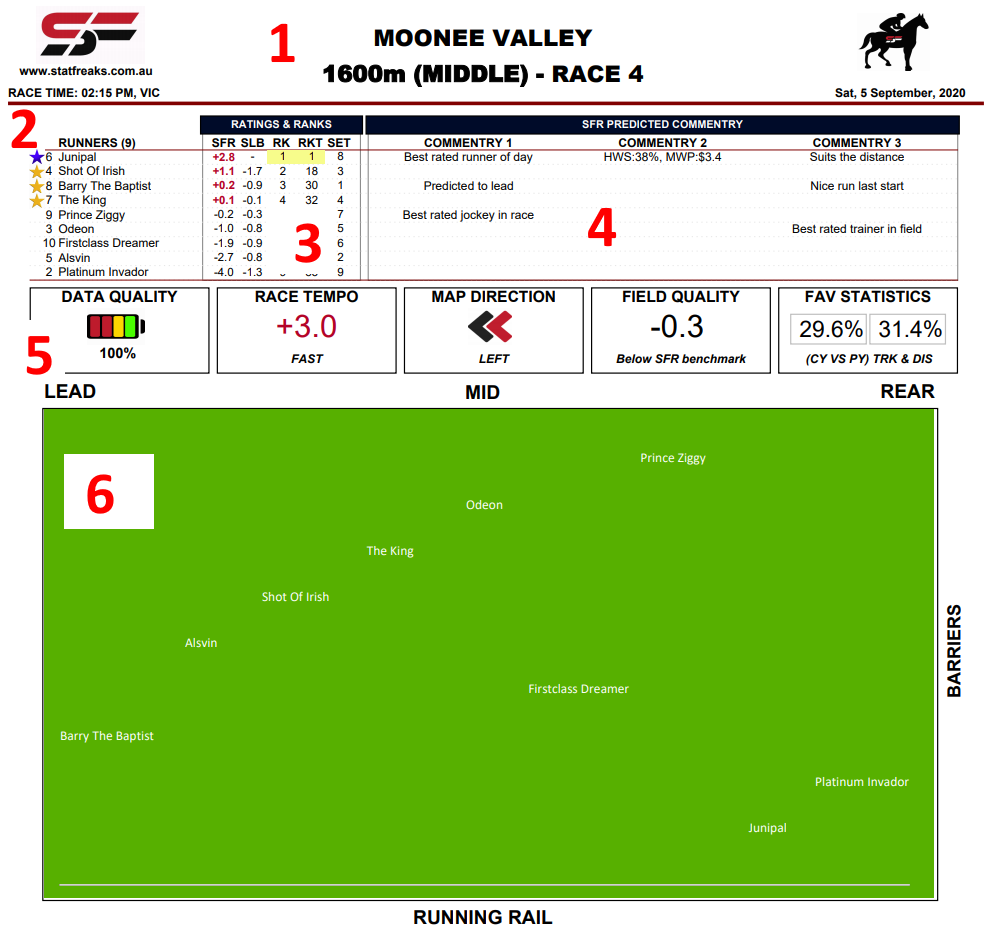
1) Date, Track, Race Number & Distance
- All our SF Rating Reports will display the Date, Track, Race Number and Distance
- The start time of the race can be found in the top left, under the statfreaks logo
- The start time, is aligned with the states local time.
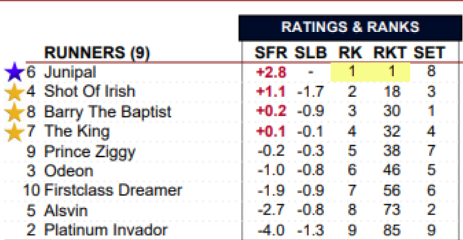
2) List of Runners with Star Rating System
- List of all runners, sorted by highest rated (On Top) to lowest rated (At Bottom)
- Star Rating Indicator
3) Ratings & Ranks
- Advanced STATFREAKS ratings and ranks for each runner measured in lengths
4) Predicted Commentary
- STATFREAKS predicted commentary generated from our advanced predictive algorithms
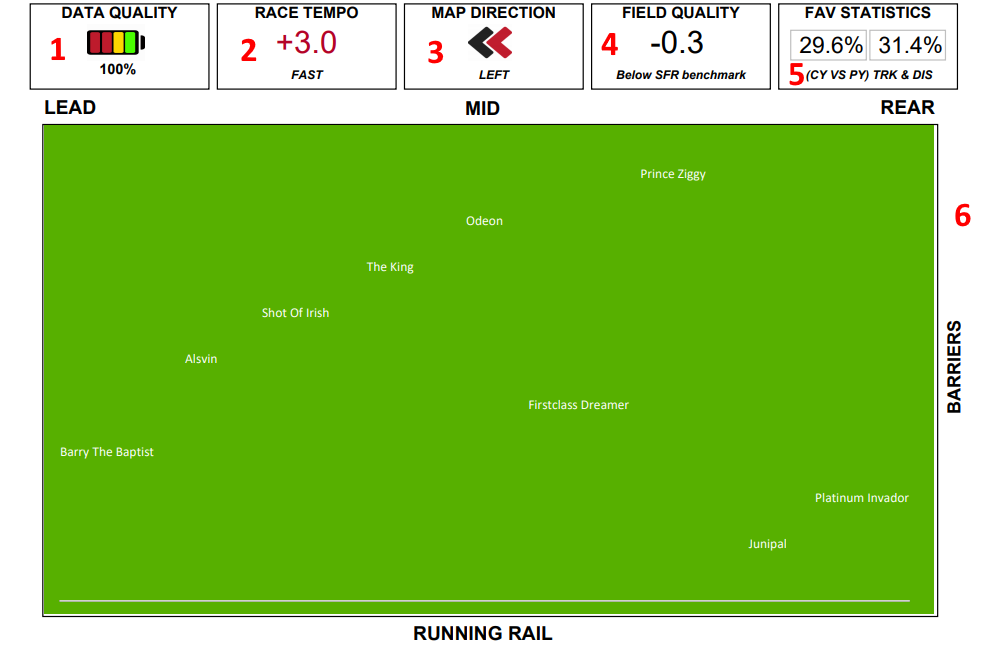
5) Race Data Details
- Provides an indicator of our data quality for a selected race, the expected race tempo, MAP director, our rated field quality and favorites historical statistics for track and distance group
6) Speed Map
- Predicted speed map generated by our advanced predictive algorithms. Displayed in the direction of how it would appear from a camera angle watching on broadcasting vision.
- SFR: STATFREAKS RATING
- The STATFREAKS Rating (SFR) is made up of over 100+ variables which we have developed and optimized over many years. Each variable has a specific weighting adjusted to how crucial it is coming into a particular race. Further to this, our predictive analytic algorithms continuously change these weights as it continues to learn over time.
- As we are constantly analyzing data and learning new things, we introduce new variables every few months, and the system automatically decided how important, or not they are for each runner.
- SLB: SFR LENGTHS BEHIND
- The SLB is a critical measure which displays the length behind the above runner. This measure was introduced to quickly identify if there is a far superior runner in a race. We have noticed that horses which have an RK of 1 and have a +1.5 SLB perform very well.
- RK: RACE RANK
- Rank of SFR against all runners for an entire race, derived from the SFR Rating.
- RKT: TRACK RANK
- Rank of SFR against all runners for the entire meeting. Generally, horses that are ranked high up on the day at the track perform exceptionally well.


- 1.DATA QUALITY
- The Data Quality Indicator displays the quality of data in percentage to how many runners we have been able to calculate accurately. We recommended treading cautiously with races which do not equate to 100%
- 2.RACE TEMO
- Race tempo predicts how fast we believe the race pace will be. Our algorithms take into account how many runners may try and lead and then assign a predicted value.
- 3.MAP DIRECTION
- Depending on the state, country the maps will change direction. We have programmed them to flow the way it would be view on TV or streaming service when the race begins, and the horses jump out of the barriers. For head-on races this is irrelevant.
- 4.FIELD QUALITY RATING
- From our SFR rating, we can determine how strong a field is running within a race. We do not derive the Field Quality Rating from the class ratings which is very different. Our SFR ratings are variable tuned from speed as the core.
- 5.FAV STATISTICS
- For each race, we display the historical favorite statistics for the track, and distance group ( “SPRINT,MIDDLE,STAYING”). This can be used to provide some insight into how well favorites perform for the track and distance.
- 6.SPEED MAP
- Each race has a visual speed map which places each runner in its predicted positions. The speed map is a critical component of the SFR Report and is also heavily factored into the SFR Rating itself.
Along side our PDF reports, we provide a detailed csv files which contains raw data variables. This can be used to further break down each race and fine tune your analysis.